by Tim C. Lueth, SG-Lib Toolbox: SolidGeometry 5.6 - CPL/Closed Polygon Lists
Introduced first in SolidGeometry 4.4, Creation date: 2018-11-09, Last change: 2025-09-14
CPLB=CPLBezier(CPL,[ns]);
CPL: | CPL | |
ns: | number of Beziercoefficients |
CPLB: | Contours of CPL as Bezier Curves |
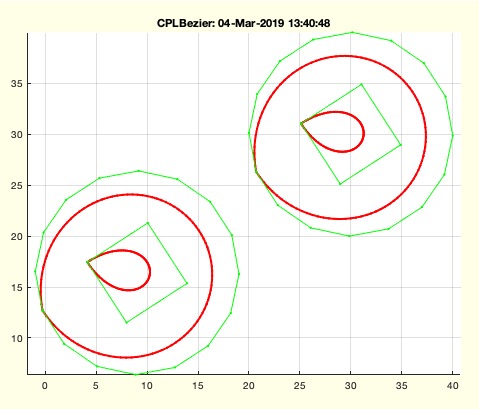
CPLBezier(CPLsample(12),5);
CPLBezier(PLtransT(CPLsample(12),TofR(rot(10),[30 30])),5);
CPLBezier(PLtransT(CPLsample(12),TofR(rot(10),[30 30])),100);This function, CPLBezier, converts Closed Polygon Lists (CPL) into Bezier curves. It is part of the SolidGeometry library and was introduced in version 4.4.
ns, using the function getfuncparams. If not specified, it defaults to 100.separateNaN to determine the number of separate polygon lists in CPL.CPLB to store the resulting Bezier curves.CPL:
i-th polygon list using separateNaN.VLBezierC with ns coefficients.CPLB, followed by a NaN NaN separator.NaN NaN separator from CPLB.nargout==0), plot the Bezier curves and the original CPL:
SGfigure to create a new figure.CPLplot.CPLplot.CPLBezier(CPLsample(12),5); - Converts a sample CPL with 12 points into Bezier curves with 5 coefficients.CPLBezier(PLtransT(CPLsample(12),TofR(rot(10),[30 30])),5); - Transforms a sample CPL and converts it into Bezier curves with 5 coefficients.CPLBezier(PLtransT(CPLsample(12),TofR(rot(10),[30 30])),100); - Transforms a sample CPL and converts it into Bezier curves with 100 coefficients.