CPLopendistance
by Tim C. Lueth, SG-Lib Toolbox: SolidGeometry 5.6 - CPL/Closed Polygon Lists
Introduced first in SolidGeometry 4.3, Creation date: 2018-10-18, Last change: 2025-09-14
returns the maximal distance between neighbor points of a contour related to the contour size
Description
This function is designed for analyzing CPLofprocessedimage contoures or CPLofimage contours
See Also: CPLofprocessedimage
, CPLofimage
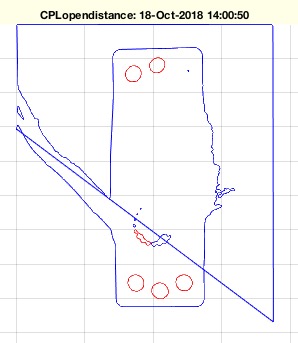
Example Illustration
Syntax
[DP,DN]=CPLopendistance(CPL)
Input Parameter
Output Parameter
DP: | | maximum distance in relation to bb of CPL |
DN: | | maximum distance between two points |
Examples
[a,b]=CPLopendistance(CPLsample(8)), CPLopendistance(CPLsample(8));
Copyright 2018-2025 Tim C. Lueth. All rights reserved. The code is the property of Tim C. Lueth and may not be redistributed or modified without explicit written permission. This software may be used free of charge for academic research and teaching purposes only. Commercial use, redistribution, modification, or reverse engineering is strictly prohibited. Access to source code is restricted and granted only under specific agreements. For licensing inquiries or commercial use, please contact: Tim C. Lueth
Algorithm (Workflow)
This function, CPLopendistance, calculates the maximum distance between neighboring points of a closed polygon line (CPL) and relates it to the contour size. It is part of the SolidGeometry library and is used for analyzing contours from processed images.
Input Parameters
- CPL: A closed polygon line represented as a list of points.
Output Results
- DP: The maximum distance in relation to the bounding box (bb) of the CPL.
- DN: The maximum distance between two neighboring points in the CPL.
Algorithm Steps
- Calculate the number of line segments (
nl) and their starting indices (sl) using the lengthNaN function.
- Determine the number of segments
n and adjust nl and sl for indexing.
- Compute the ending indices
el for each segment.
- Initialize arrays
DP, DN, and ss to store results.
- For each segment
i from 1 to n:
- Extract the segment
CPLi from CPL using sl(i) and el(i).
- Calculate the size of the bounding box
ss(i) using sofBB and BBofCPL.
- Compute the differences
DLi between consecutive points in CPLi using circshift.
- Normalize the differences and find the maximum distance
DN(i) using PLnorm.
- Calculate
DP(i) as the ratio of DN(i) to ss(i).
- If no output arguments are specified, plot the CPL:
- Calculate the mean of
DP.
- Plot segments with
DP greater than the mean in blue and others in red using CPLplot and selectNaN.
Algorithm explaination created using ChatGPT on 2025-08-19 01:28. (Please note: No guarantee for the correctness of this explanation)
Last html export of this page out of FM database by TL: 2025-09-21