CPLregions2cell
by Tim C. Lueth, SG-Lib Toolbox: SolidGeometry 5.6 - CPL/Closed Polygon Lists
Introduced first in SolidGeometry 5.4, Creation date: 2023-12-20, Last change: 2025-09-15
returns CPL as cell list of CPLs separated by not-overlapping outer-border CPLs
Description
reverse function is: CPLcell2NaN
See Also: CPLsortinout
, CPLregions
, PSregions
, CPLcell2NaN
Example Illustration
Syntax
CPL=CPLregions2cell(ps)
Input Parameter
Output Parameter
CPL: | | cell list of CPLs separated by not-overlapping outer-border CPLs |
Examples
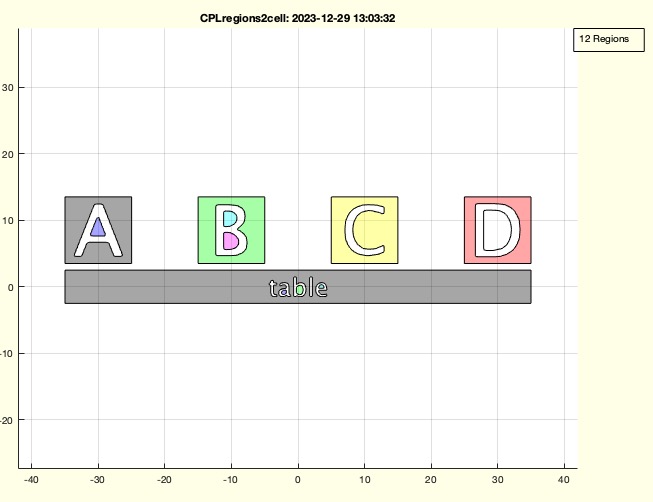
CPLbox('','A'); A=ans; CPLbox('','B'); B=ans; CPLbox('','C'); C=ans; CPLbox('','D'); D=ans;
CPLbox([70 5],'table'); T=ans;
CPLarrange({A,B,C,D},T,'ontop',1,'add'); CPL=ans; SGfigure; CPSplot(CPL);
CPLregions2cell(CPL), CPLN=ans;
Copyright 2023-2025 Tim C. Lueth. All rights reserved. The code is the property of Tim C. Lueth and may not be redistributed or modified without explicit written permission. This software may be used free of charge for academic research and teaching purposes only. Commercial use, redistribution, modification, or reverse engineering is strictly prohibited. Access to source code is restricted and granted only under specific agreements. For licensing inquiries or commercial use, please contact: Tim C. Lueth
Algorithm (Workflow)
This function, CPLregions2cell, is designed to process a NaN-separated Closed Polygon List (CPL) and return a cell list of CPLs that are separated by non-overlapping outer-border CPLs.
Input Parameters
- ps: A NaN-separated CPL, which is a list of closed polygons where each polygon is separated by NaN values.
Output
- CPL: A cell list of CPLs, where each cell contains the vertices of a non-overlapping outer-border CPL.
Algorithm Steps
- The function begins by converting the input
ps into a polyshape object using the regions function. This step identifies distinct polygonal regions within the input.
- The number of distinct regions is determined using
numel(ps), and a cell array CPL is initialized to store these regions.
- A loop iterates over each region, extracting the vertices of each polygon and storing them in the corresponding cell of the
CPL array.
- If no output argument is specified, the function prints the number of regions and plots each region using
CPSplot with a unique color for each.
Additional Notes
The function includes commented-out code that suggests an alternative method for processing the regions, but this part is not executed in the current implementation.
Algorithm explaination created using ChatGPT on 2025-08-19 07:21. (Please note: No guarantee for the correctness of this explanation)
Last html export of this page out of FM database by TL: 2025-09-21