CPSofgca
by Tim C. Lueth, SG-Lib Toolbox: SolidGeometry 5.6 - CPL/Closed Polygon Lists
Introduced first in SolidGeometry 4.5, Creation date: 2019-02-11, Last change: 2025-09-14
returns a struct called Colored PolyShape (CPS) similar to a polygon array object
Description
Matlab introduced new classes polygon as graphics object and polyshape as geometric object.
Nevertheless, SG-Lib usees either CPL, polyshapes or colored polyshapes that consist
ps polyshape array
fc facecolor array
fa facealpha array
ec edgecolor array
similar to poygon
See Also: CPLplotasPS
, CPSofpolygon
Example Illustration
Syntax
CPS=CPSofgca([h])
Input Parameter
h: | | optional handle to implement CPSofpolygon |
Output Parameter
CPS: | | struct with ps, fc, fa, ec
|
Examples
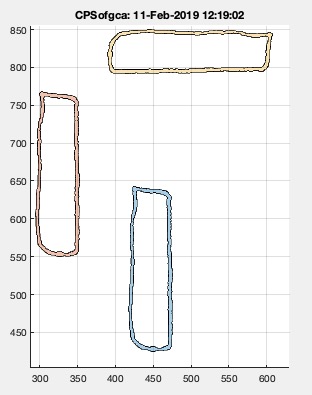
SGfigure; CPSplot(CPLsample(29),'b',.1,'g',2)
shg; CPSofgca
Copyright 2019-2025 Tim C. Lueth. All rights reserved. The code is the property of Tim C. Lueth and may not be redistributed or modified without explicit written permission. This software may be used free of charge for academic research and teaching purposes only. Commercial use, redistribution, modification, or reverse engineering is strictly prohibited. Access to source code is restricted and granted only under specific agreements. For licensing inquiries or commercial use, please contact: Tim C. Lueth
Algorithm (Workflow)
The function CPSofgca is designed to extract and return a structured representation of colored polyshapes from the current axes in a MATLAB figure. It is part of the SG-Library and works with polygon and polyshape objects.
Input Parameters
- h: An optional handle to a polygon or polyshape object. If not provided, the function defaults to using the current axes (
gca).
Output
- CPS: A struct containing the following fields:
- ps: An array of polyshape objects.
- fc: An array of face colors.
- fa: An array of face alpha (transparency) values.
- ec: An array of edge colors.
- lw: An array of line widths.
Algorithm Steps
- Retrieve the handle
h using getfuncparams. If h is not provided, use gca (current axes).
- Check if
h is a polygon object. If not, find all polygon objects in the current axes using findobj.
- If no polygon or polyshape objects are found, return an empty
CPS and display a warning.
- Extract the properties of the polyshape objects:
- Use
elem2array to convert the Shape, FaceColor, FaceAlpha, EdgeColor, and LineWidth properties into arrays and store them in the CPS struct.
- If no output is requested (
nargout == 0), create a new figure and plot each polyshape with its corresponding properties.
Example Usage
The function can be used in conjunction with other functions from the SG-Library, such as CPLplotasPS, to visualize and manipulate polyshape objects in MATLAB.
Algorithm explaination created using ChatGPT on 2025-08-19 08:04. (Please note: No guarantee for the correctness of this explanation)
Last html export of this page out of FM database by TL: 2025-09-21