CVLofcontourc
by Tim C. Lueth, SG-Lib Toolbox: SolidGeometry 5.6 - CPL/Closed Polygon Lists
Introduced first in SolidGeometry 3.6, Creation date: 2017-03-18, Last change: 2025-09-14
converts the contourc format into the CVL format
Description
Matlab's contourc function is a powerful function to create contours from image bit maps similar to the marching cube function in 3D. Nevertheless the resulting point list format is outdated. This function converts the contourc format into the CVL format. The z values are the contourc intesity(z) values.
See Also: CPLofcontourc
, CPLofimage
, SGofVMdelaunay
, SGofVMmarchcube
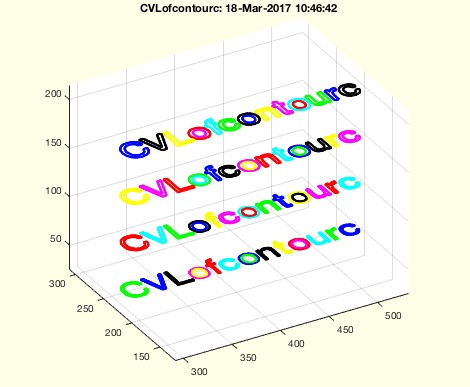
Example Illustration
Syntax
CVL=CVLofcontourc(C,[rem])
Input Parameter
C: | | result of the contourc function |
rem: | | removes straight lines if true; default is false |
Output Parameter
CVL: | | Closed polygon list [nx3] with the z values for the contour |
Examples
figure; axis off; text(0.5,0.5,'This is a Test', 'FontSize',36)
I=getframe(gcf);
CVLofcontourc(contourc(1/3*sum(flipud(I.cdata),3),4))
Copyright 2017-2025 Tim C. Lueth. All rights reserved. The code is the property of Tim C. Lueth and may not be redistributed or modified without explicit written permission. This software may be used free of charge for academic research and teaching purposes only. Commercial use, redistribution, modification, or reverse engineering is strictly prohibited. Access to source code is restricted and granted only under specific agreements. For licensing inquiries or commercial use, please contact: Tim C. Lueth
Algorithm (Workflow)
This function, CVLofcontourc, converts the output of Matlab's contourc function into a closed polygon list (CVL format). The function is designed to handle contours from image bitmaps, similar to the marching cubes function in 3D.
Input Parameters
- C: The result of the contourc function, which contains contour data.
- rem: A boolean parameter that, if true, removes straight lines from the contour. The default value is false.
Output
- CVL: A closed polygon list in the format [nx3], where the third column contains the z-values for the contour.
Algorithm Steps
- Initialize the
rem parameter to true if provided, otherwise default to false.
- Transpose the input matrix
C and append a column of NaN values to create CVL.
- Initialize variables
k and n to track the number of contours and the size of CVL, respectively.
- Iterate over the rows of
CVL to assign z-values to the contour points:
- For each contour, assign the z-value from the first row of the contour to all subsequent points in that contour.
- Update the index
i to skip to the next contour.
- Track the end of each contour using the
ck array.
- Remove the rows in
CVL that mark the end of each contour by setting them to NaN.
- If the
rem parameter is true, call the CVLremstraight function to remove straight lines from the contour.
- If no output is requested, plot the CVL using
CVLplot with a red line.
Algorithm explaination created using ChatGPT on 2025-08-19 08:06. (Please note: No guarantee for the correctness of this explanation)
Last html export of this page out of FM database by TL: 2025-09-21