by Tim C. Lueth, SG-Lib Toolbox: SolidGeometry 5.6 - CPL/Closed Polygon Lists
Introduced first in SolidGeometry 4.0, Creation date: 2017-07-23, Last change: 2025-09-14
See Also: CVLseparatez
, CVLzreplace
, CVLzseparate
XVL=CVLremovez(CVL,z)
CVL: | Contour vertex list | |
z: | list of z values to remove |
XVL: | New Contour vertex list |
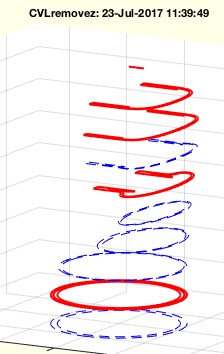
load JACO_robot.mat; CVL=CVLofSGslices(JC0,10);
z=CVLseparatez(CVL)
CVLremovez(CVL,z([1 3 4 5 7]))This algorithm is designed to remove specific z-values from a contour vertex list (CVL) and clean up any resulting data inconsistencies. Below is a detailed explanation of the algorithm and its parameters.
The algorithm first identifies and removes all rows in the CVL where the z-value (third column) matches any value in the input list z. This is done using the ismember function, which checks for membership of each z-value in the list z. The result is stored in the variable XVL.
After removing the specified z-values, the algorithm checks for consecutive NaN values in the first column of XVL. It uses the isnan function to identify NaN values and circshift to shift the array for comparison. Rows with consecutive NaN values are removed from XVL.
If the function is called without an output argument, it will display a plot of the original CVL and the modified XVL. The original CVL is plotted with a blue dashed line, and the modified XVL is plotted with a red solid line of thickness 2. This visualization is done using the SGfigure and CVLplot functions.