PLBezierC
by Tim C. Lueth, SG-Lib Toolbox: SolidGeometry 5.6 - PL/Point Lists
Introduced first in SolidGeometry 5.2, Creation date: 2022-03-03, Last change: 2025-09-15
Bezier splines for open point list
Description
exactly the same as VLBezierC but handles the 2D output
See Also: VLBezierC
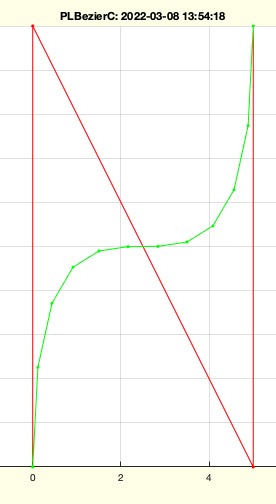
Example Illustration
Syntax
PL=PLBezierC(PL,[k])
Input Parameter
PL: | | 2D Point list |
k: | | number of points of the Bezier curve; default is size(PL,1) |
Output Parameter
Examples
PLBezierC(PLsample(6),12)
Copyright 2022-2025 Tim C. Lueth. All rights reserved. The code is the property of Tim C. Lueth and may not be redistributed or modified without explicit written permission. This software may be used free of charge for academic research and teaching purposes only. Commercial use, redistribution, modification, or reverse engineering is strictly prohibited. Access to source code is restricted and granted only under specific agreements. For licensing inquiries or commercial use, please contact: Tim C. Lueth
Algorithm (Workflow)
This function, PLBezierC, is designed to generate Bezier splines for a given open point list in 2D. It is part of the SolidGeometry library and was introduced in version 5.2. The function is similar to VLBezierC but specifically handles 2D output.
Input Parameters
- PL: A 2D point list that represents the input points for which the Bezier curve will be generated.
- k: An optional parameter that specifies the number of points on the Bezier curve. If not provided, the default is the number of points in
PL (i.e., size(PL,1)).
Output Results
- PL: A 2D point list representing the generated Bezier curve.
Algorithm Steps
- The function begins by calling
VLBezierC with the input point list PL and any additional arguments provided in varargin. This function generates a Bezier curve based on the input points.
- The result from
VLBezierC is stored in PLN.
- The function then extracts the first two columns of
PLN to ensure the output is a 2D point list.
- If no output argument is specified (i.e.,
nargout==0), the function will plot the original point list PL in red and the generated Bezier curve PLN in green using the SGfigure and PLplot functions.
Example Usage
An example call to the function is PLBezierC(PLsample(6),12), which generates a Bezier curve with 12 points from a sample point list of 6 points.
Algorithm explaination created using ChatGPT on 2025-08-18 22:59. (Please note: No guarantee for the correctness of this explanation)
Last html export of this page out of FM database by TL: 2025-09-21