by Tim C. Lueth, SG-Lib Toolbox: SolidGeometry 5.6 - Auxiliary function
Introduced first in SolidGeometry 2.7, Creation date: 2015-10-01, Last change: 2025-09-14
See Also: PLminangle
, PLminxy
[P,pi]=PLminyx(PL,[maxY])
PL: | Point Liste | |
maxY: | if true; we search for maximum y and maximum x |
P: | Point with minimal y and minimal x | |
pi: | find index in PL |
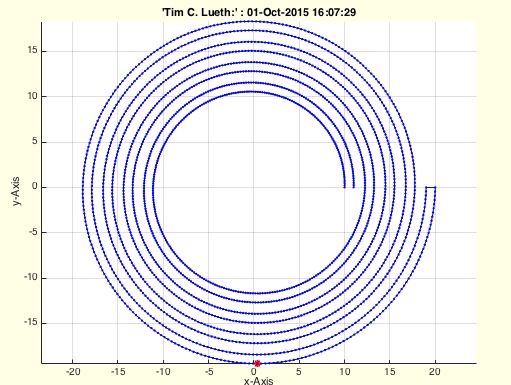
CPLB=CPLspiral(10,20,8*pi);
PLminyx(CPLB)
PLminyx(CPLB,true)
[~,ci]=PLminyx(CPLB); CPLB=circshift(CPLB,-(ci-1));This function, PLminyx, is designed to find a specific point in a list of points, PL. The point is determined based on its y and x values, either minimal or maximal, depending on the input parameters.
true, the function searches for the point with the maximum y and x values. If false or not provided, it searches for the point with the minimum y and x values.P in the original list PL.PL in PLorg.PL to 5 decimal places for precision.PL, assuming these are the x and y coordinates.maxY to false. If a second argument is provided and is not empty, set maxY to the value of this argument.maxY:
maxY is false, find the minimum y value in PL. Then, find the minimum x value among the points with this y value.maxY is true, find the maximum y value in PL. Then, find the maximum x value among the points with this y value.P to the point with the determined x and y values.k of this point in the original list PLorg.SGfigure and highlight the found point.