PLsampletriangles
by Tim C. Lueth, SG-Lib Toolbox: SolidGeometry 5.6 - Samples
Introduced first in SolidGeometry 4.9, Creation date: 2020-02-18, Last change: 2025-09-14
creates extreme triangle geometries
See Also: , VLsampletriangles
, PLtriangle
Example Illustration
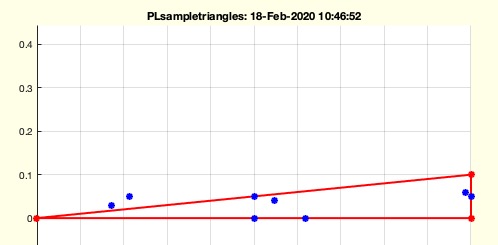
Syntax
PLsampletriangles([z,n])
Input Parameter
z: | | extreme dimension; default is 1e-15 |
n: | | number of additional random point around the triangle |
Examples
PLsampletriangles
Copyright 2020-2025 Tim C. Lueth. All rights reserved. The code is the property of Tim C. Lueth and may not be redistributed or modified without explicit written permission. This software may be used free of charge for academic research and teaching purposes only. Commercial use, redistribution, modification, or reverse engineering is strictly prohibited. Access to source code is restricted and granted only under specific agreements. For licensing inquiries or commercial use, please contact: Tim C. Lueth
Algorithm (Workflow)
This function, PLsampletriangles, generates extreme triangle geometries. It is part of the SolidGeometry library and was introduced in version 4.9. The function takes two optional input parameters:
- z: This represents the extreme dimension of the triangle. If not provided, it defaults to 1e-15.
- n: This is the number of additional random points around the triangle. If not specified, it defaults to 0.
The algorithm proceeds as follows:
- Retrieve the input parameters
z and n using the getfuncparams function. If not provided, default values are used.
- Set a small perturbation value
e to 0.1.
- Generate
n random points in a 2D space using rand(n,2). These points are scaled and shifted by e to create a small random distribution around the triangle.
- Adjust the second column of the random points to ensure they are positioned around the triangle by subtracting the first column from the second.
- Define the initial triangle vertices in a 2D plane as
PL = [1 0; 0 0; 0 1].
- If there are additional random points, append them to the initial triangle vertices.
- Calculate the barycentric coordinates for the points using
UVW = [PL 1-sum(PL,2)].
- Create a triangulation object
TR with vertices at [0 0; 1 z; 0 1].
- Convert the barycentric coordinates to Cartesian coordinates using
barycentricToCartesian function.
- If no output is requested, plot the triangle and additional points using
SGfigure, CVLplot, and PLplot functions.
The function is designed to visualize the triangle and any additional random points in a 2D space, providing a graphical representation of the generated geometry.
Algorithm explaination created using ChatGPT on 2025-08-19 00:44. (Please note: No guarantee for the correctness of this explanation)
Last html export of this page out of FM database by TL: 2025-09-21