PLsortC
by Tim C. Lueth, SG-Lib Toolbox: SolidGeometry 5.6 - PL/Point Lists
Introduced first in SolidGeometry 2.0, Creation date: 2014-12-02, Last change: 2025-09-14
returns a point list that is sorted around its' center
Description
Uses VLsortC. All points are part of the resulting list.
See Also: PLconvexhull
, PLconvexseg
, CPLsortC
, CPLsortinout
, VLsortC
Example Illustration
Syntax
[NPL,WL,DL]=PLsortC(PL,[d])
Input Parameter
PL: | | Original point list |
d: | | order same angle: 'outer' | 'inner'; default is 'inner' |
Output Parameter
NPL: | | Sorted point list |
WL: | | Angle list |
DL: | | Distance list |
Examples
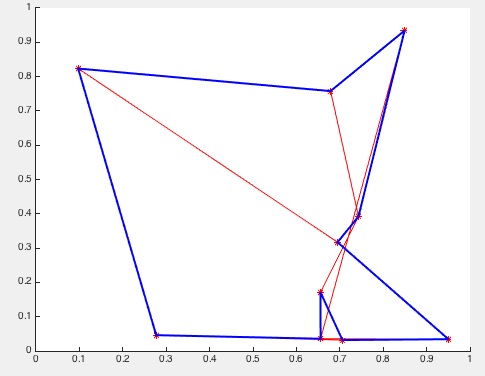
Sort a random point list
close all;
for i=1:10; PL(i,:)=[rand rand]; end;
CPLplot (PL); CPLplot(PLsortC(PL),'b',2); show
Copyright 2014-2025 Tim C. Lueth. All rights reserved. The code is the property of Tim C. Lueth and may not be redistributed or modified without explicit written permission. This software may be used free of charge for academic research and teaching purposes only. Commercial use, redistribution, modification, or reverse engineering is strictly prohibited. Access to source code is restricted and granted only under specific agreements. For licensing inquiries or commercial use, please contact: Tim C. Lueth
Algorithm (Workflow)
This function, PLsortC, sorts a list of 2D points around their center. It is part of the SolidGeometry library and was introduced in version 2.0. The function relies on another function, VLsortC, to perform the sorting.
Input Parameters
- PL: The original list of points that need to be sorted. Each point is represented as a row in a matrix.
- d: An optional parameter that determines the order of points with the same angle. It can be either 'outer' or 'inner'. The default value is 'inner'.
Output Results
- NPL: The sorted list of points.
- WL: A list of angles corresponding to each point in the sorted list.
- DL: A list of distances from the center to each point in the sorted list.
Algorithm Steps
- The function starts by checking if the optional parameter
d is provided. If not, it defaults to 'inner'.
- The function
VLaddz is called to add a zero z-coordinate to each point in the list PL, converting it to a 3D point list.
- The function
VLsortC is then called with the 3D point list and any additional arguments. This function sorts the points based on their angles and distances from the center.
- The sorted list of points,
NPL, is then reduced back to 2D by removing the z-coordinate.
- If no output arguments are specified, the function plots the original and sorted point lists for visual comparison. The original points are plotted in red, and the sorted points are plotted in blue.
Example Usage
The example provided in the comments demonstrates how to sort a random list of points and plot the results. It generates 10 random points, sorts them using PLsortC, and then plots both the original and sorted points.
Algorithm explaination created using ChatGPT on 2025-08-19 01:21. (Please note: No guarantee for the correctness of this explanation)
Last html export of this page out of FM database by TL: 2025-09-21