SGgyroid
by Brian Li & Tim Lueth, SG-Lib Toolbox: SolidGeometry 5.6 - Surfaces
Introduced first in SolidGeometry 5.2, Creation date: 2022-08-08, Last change: 2025-09-15
creates a gyroid shape solid
See Also: SGmeshground
, VLFLweave
Example Illustration
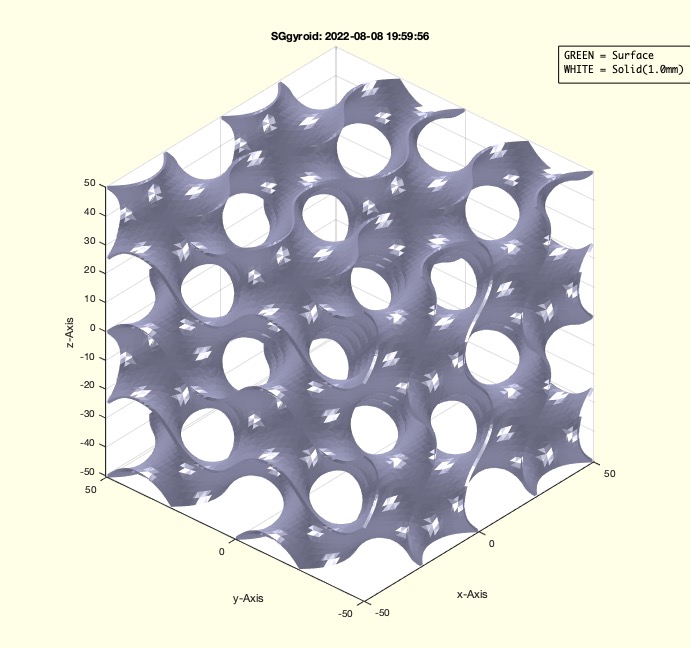
Syntax
SG=SGgyroid([R,w,D])
Input Parameter
R: | | Cubic size |
w: | | angle; default is 4*pi |
D: | | wall Thicknessl default is 0 |
Output Parameter
Copyright 2022-2025 Tim C. Lueth. All rights reserved. The code is the property of Tim C. Lueth and may not be redistributed or modified without explicit written permission. This software may be used free of charge for academic research and teaching purposes only. Commercial use, redistribution, modification, or reverse engineering is strictly prohibited. Access to source code is restricted and granted only under specific agreements. For licensing inquiries or commercial use, please contact: Tim C. Lueth
Algorithm (Workflow)
This function, SGgyroid, generates a gyroid shape solid. It is part of the SG-Library and was developed by Brian Li & Tim Lueth. The function takes three input parameters and returns a gyroid solid.
Input Parameters
- R: Cubic size, specified as a vector. The default is [10, 0]. The first element is used to define the range from -R to +R with 30 steps.
- w: Angle over 2*R, with a default value of 4*pi.
- D: Wall thickness, with a default value of 0.
Output
- SG: The resulting gyroid solid.
Algorithm Steps
- Retrieve the input parameters using the
getfuncparams function. This function extracts the parameters from the input arguments or assigns default values if not provided.
- Calculate
nmin using the function nofrd and adjust it based on the angle w.
- If
n is zero, set it to four times nmin.
- Adjust
w by dividing it by 2*R.
- Create a 3D grid using
meshgrid over the range from -R to R with n steps.
- Calculate the gyroid surface using the formula:
v = sin(x/w)*cos(y/w) + sin(y/w)*cos(z/w) + sin(z/w)*cos(x/w).
- Extract the isosurface from the grid using the
isosurface function, which provides the vertices and faces of the gyroid surface.
- If
D is greater than 0, create a solid gyroid using the SGofSurface function, which offsets the surface by D.
- If
D is 0, the gyroid is represented only by its surface.
- If no output is requested, visualize the gyroid using
SGfigure and SGplotalpha. The color of the plot depends on whether the gyroid is a surface or a solid.
Algorithm explaination created using ChatGPT on 2025-08-19 01:20. (Please note: No guarantee for the correctness of this explanation)
Last html export of this page out of FM database by TL: 2025-09-21