SGsurfacehistogram
by Tim C. Lueth, SG-Lib Toolbox: SolidGeometry 5.6 - Surfaces
Introduced first in SolidGeometry 3.8, Creation date: 2017-04-04, Last change: 2025-09-14
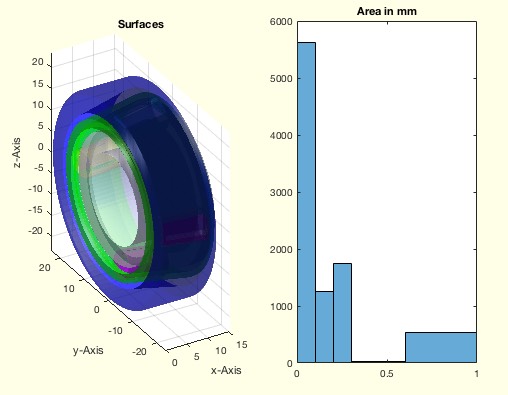
plots a surface area histogram of selected surfaces
Description
This function is useful to analyze imported STL files generated by a CSG modeler such as Catia.
Rounded edges or broken corners makes it difficult to analyze functional surface manually. This function helps to get a feeling for the CSG-to-STL conversion strategy.
See Also: , SGsurfaces
Example Illustration
Syntax
SGsurfacehistogram(B,[si,be])
Input Parameter
B: | | Solid Geoemtry |
si: | | surface index wrt SGsurfaces; default '' |
be: | | histogram bin edges; default is be=[0 0.1 0.2 0.3 0.4 0.5 0.6 1.0];
|
Examples
SGsurfacehistogram(SGsample(17))
SGsurfacehistogram(SGsample(17),'',1:10)
Copyright 2017-2025 Tim C. Lueth. All rights reserved. The code is the property of Tim C. Lueth and may not be redistributed or modified without explicit written permission. This software may be used free of charge for academic research and teaching purposes only. Commercial use, redistribution, modification, or reverse engineering is strictly prohibited. Access to source code is restricted and granted only under specific agreements. For licensing inquiries or commercial use, please contact: Tim C. Lueth
Algorithm (Workflow)
This function, SGsurfacehistogram, is designed to plot a surface area histogram of selected surfaces from a solid geometry object. It is particularly useful for analyzing imported STL files generated by CSG modelers like Catia.
Input Parameters
- B: Solid Geometry object. This is the primary input representing the 3D model.
- si: Surface index with respect to
SGsurfaces. It is optional and defaults to an empty string ('').
- be: Histogram bin edges. It is optional and defaults to a range from 0 to 2 in increments of 0.1.
Algorithm Steps
- Initialize
si to an empty string if not provided.
- Set default bin edges
be to a range from 0 to 2 in increments of 0.1.
- If a second argument is provided and not empty, update
si with this value.
- If a third argument is provided and not empty, update
be with this value.
- Call
SGsurfaces with B and si to get the surfaces of the solid geometry.
- Use
VLFLofSG to obtain vertex list (VL) and face list (FL) from the solid geometry.
- Calculate the area of each face using
VLFLnormf with the vertex and face lists.
- Create a new figure window using
SGfigure and set the title with SGtitle.
- Plot the surfaces in a subplot using
SGsurfaceplot and set the view angle.
- Plot the histogram of the face areas in another subplot using
histogram with the specified bin edges.
Algorithm explaination created using ChatGPT on 2025-08-19 06:49. (Please note: No guarantee for the correctness of this explanation)
Last html export of this page out of FM database by TL: 2025-09-21