SGvertexongrid
by Tim C. Lueth, SG-Lib Toolbox: SolidGeometry 5.6 - Surfaces
Introduced first in SolidGeometry 4.1, Creation date: 2017-09-01, Last change: 2025-09-14
returns a solid geometry with all vertices set to a grid
Description
Three important functions to be used in combination with SGbool:
SGvertexongrid - maps all vertices of a solid to a grid
SGretesselate - removes small facets from a solid
SGdelaunay - retesselates alls surfaces by delaunay
See Also: VLFLvertexongrid
Example Illustration
Syntax
B=SGvertexongrid([A,grid1,grid2])
Input Parameter
A: | | Solid Geoemtry |
grid1: | | default is 1e-3 points mapped to the same coordinates |
grid2: | | default is 0.25*grid 1 grid the last point is mapped to |
Output Parameter
Examples
SG=SGsample(5), SGvertexongrid(SG,1), VLmindxyz(ans)
Copyright 2017-2025 Tim C. Lueth. All rights reserved. The code is the property of Tim C. Lueth and may not be redistributed or modified without explicit written permission. This software may be used free of charge for academic research and teaching purposes only. Commercial use, redistribution, modification, or reverse engineering is strictly prohibited. Access to source code is restricted and granted only under specific agreements. For licensing inquiries or commercial use, please contact: Tim C. Lueth
Algorithm (Workflow)
This function, SGvertexongrid, is designed to map all vertices of a solid geometry to a specified grid. It is part of the SG-Library and is used in combination with other functions like SGretesselate and SGdelaunay.
Input Parameters
- A: The solid geometry to be processed. If not provided, a sample solid geometry is used.
- grid1: The primary grid spacing. Default value is 1e-3 mm. It determines the precision of the vertex mapping.
- grid2: The secondary grid spacing, set to 0.25 times
grid1 by default. It is used for finer adjustments.
Output
- B: The resulting solid geometry with vertices mapped to the grid.
Algorithm Steps
- Initialize the solid geometry
A with a sample if not provided.
- Set
grid1 to 1e-2 mm if not specified, and grid2 to 0.25 times grid1.
- Extract vertex list
VL and face list FL from the solid geometry A using VLFLofSG.
- Call
VLFLvertexongrid with VL, FL, grid1, and grid2 to map vertices to the grid.
- If no output is requested, visualize the original and grid-forced solids using
SGplot and VLFLplotfreeboundary.
Visualization
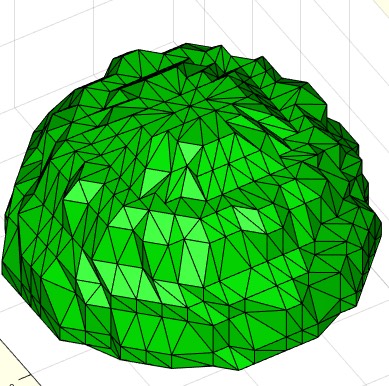
If the function is called without output arguments, it will display a figure with two subplots:
- The first subplot shows the original solid geometry in red.
- The second subplot shows the grid-forced solid geometry in green.
Both views are set to an angle of -30 degrees azimuth and 30 degrees elevation.
Algorithm explaination created using ChatGPT on 2025-08-19 08:29. (Please note: No guarantee for the correctness of this explanation)
Last html export of this page out of FM database by TL: 2025-09-21