by Tim C. Lueth, SG-Lib Toolbox: SolidGeometry 5.6 - Samples
Introduced first in SolidGeometry 4.2, Creation date: 2018-07-28, Last change: 2025-08-18
Tsample
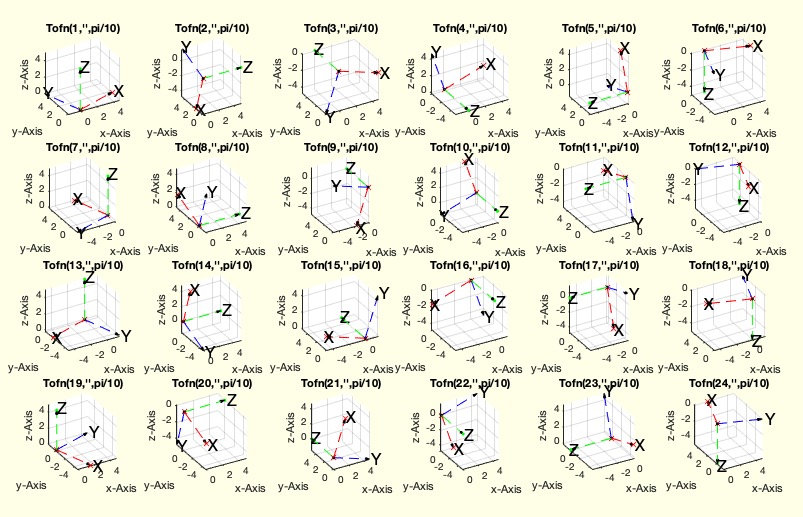
This algorithm is a MATLAB function named Tsample that visualizes transformations using the Tofn function from the SG-Library. The function does not take any input parameters and does not return any output. It is designed to create a figure with multiple subplots, each displaying a transformation matrix.
The function Tsample does not have any input parameters.
SGfigure, which likely initializes a new figure window for plotting.w is defined and set to pi/10. This variable represents an angular frequency or a similar parameter used in the transformation.for loop iterates from 1 to 24. In each iteration, the following steps are performed:Tofn is called with three arguments: the current loop index i, an empty string '', and the variable w. This function likely computes a transformation matrix based on these inputs.Tofn is stored in the variable Ti.i.tplot is called with Ti and the number 5 as arguments. This function likely plots the transformation matrix Ti in the current subplot.title with a formatted string that includes the current loop index i.view(-30,30), which adjusts the 3D plot's perspective.The function does not return any output. It generates a figure with 24 subplots, each displaying a transformation matrix computed by the Tofn function.