VLFLregions
by Tim C. Lueth, SG-Lib Toolbox: SolidGeometry 5.6 - Surfaces
Introduced first in SolidGeometry 5.1, Creation date: 2021-07-27, Last change: 2025-09-15
fnct to separate regions in face index list
Description
This is the modern version of VLFLseparate. It is used for instance in FSofSGnormal.
Following the terms of Matlab in the polyshape classe, I now also use the term regions for surfaces that are connected to each other. In previous versions, only the term VLFLseparate or SGseparate was used. Based on FLorder
See Also: SGseparate
, SGsurfaces
, FLorder
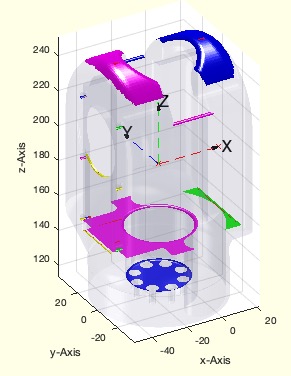
Example Illustration
Syntax
fil=VLFLregions(VL,FL,[FIL])
Input Parameter
VL: | | Vertex list |
FL: | | Facet list |
FIL: | | ONE facet index list; default is 1:size(FL,1) |
Output Parameter
fil: | | cell list for separated regions |
Copyright 2021-2025 Tim C. Lueth. All rights reserved. The code is the property of Tim C. Lueth and may not be redistributed or modified without explicit written permission. This software may be used free of charge for academic research and teaching purposes only. Commercial use, redistribution, modification, or reverse engineering is strictly prohibited. Access to source code is restricted and granted only under specific agreements. For licensing inquiries or commercial use, please contact: Tim C. Lueth
Algorithm (Workflow)
This function, VLFLregions, is designed to separate regions in a face index list. It is a modern version of VLFLseparate and is used in the context of surface geometry processing.
Input Parameters
- VL: Vertex list, which contains the coordinates of vertices.
- FL: Facet list, which contains indices of vertices forming each facet.
- FIL: Optional facet index list. If not provided, it defaults to
1:size(FL,1), meaning all facets are considered.
Output
- fil: A cell list containing separated regions, where each cell corresponds to a region of connected facets.
Algorithm Steps
- Initialize
FIL using getfuncparams to handle optional input, defaulting to all facets if not specified.
- Extract the subset of facets
FLS from FL using the indices in FIL.
- Order the facets using
ELorder, which returns FLN (ordered facets) and SIL (start and end indices of regions).
- Map the rows of
FLS to FLN using maprows to get the mapping indices b.
- Determine the number of regions
nf from the size of SIL.
- Initialize
fil as a cell array to store each region.
- For each region
k from 1 to nf:
- Extract the range of indices from
SIL and map them back to the original facet indices using b.
- Store the mapped indices in
fil{k}.
- If no output is requested (
nargout==0), plot the regions:
- Use
SGfigure to set up the figure.
- Plot all facets with a low alpha value using
VLFLplotalpha.
- Iterate over each region and plot it with a distinct color using
colofn to select the color.
Algorithm explaination created using ChatGPT on 2025-08-19 06:51. (Please note: No guarantee for the correctness of this explanation)
Last html export of this page out of FM database by TL: 2025-09-21