VMginput
by Tim C. Lueth, SG-Lib Toolbox: SolidGeometry 5.6 - User interface
Introduced first in SolidGeometry 3.6, Creation date: 2017-03-20, Last change: 2025-09-14
returns a point position by clicking into VMplot
Description
This function is based on ginput, waitforbuttonpress, get(gca,'CurrentPoint').
If the window is magnified, it has to be in the center of the screen
See Also: VMplot
, VMgetSubplot
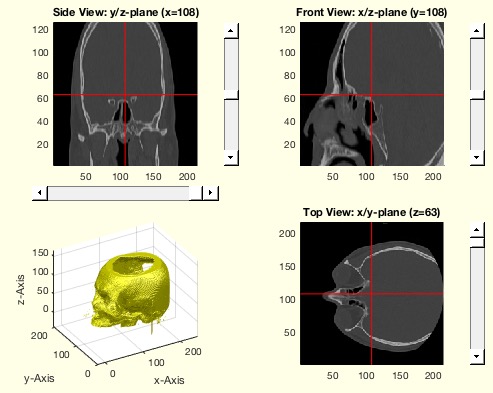
Example Illustration
Syntax
[PL,t]=VMginput([n,u])
Input Parameter
n: | | number of points |
u: | | update VMplot; default is true |
Output Parameter
Copyright 2017-2025 Tim C. Lueth. All rights reserved. The code is the property of Tim C. Lueth and may not be redistributed or modified without explicit written permission. This software may be used free of charge for academic research and teaching purposes only. Commercial use, redistribution, modification, or reverse engineering is strictly prohibited. Access to source code is restricted and granted only under specific agreements. For licensing inquiries or commercial use, please contact: Tim C. Lueth
Algorithm (Workflow)
This function, VMginput, is designed to capture user input points from a plot, similar to MATLAB's ginput function. It is part of the SG-Library and is used in conjunction with VMplot and VMgetSubplot.
Input Parameters
- n: The number of points to capture. Default is 1 if not specified.
- u: A boolean indicating whether to update the VMplot. Default is true.
Output Results
- PL: The positions of the points captured.
- t: The subplot index where the point was captured.
Algorithm Steps
- Initialize the number of points
n and update flag u based on input arguments.
- Initialize empty arrays
PL and TL to store point positions and subplot indices.
- Loop for
n times to capture points:
- Use
ginput(1) to capture a single point from the plot.
- Extract x and y coordinates from the captured point.
- Determine the subplot index
t using VMgetSubplot.
- Use a switch statement to add the missing coordinate based on the subplot index:
- Case 1: Set
p = [VMplotPos(1) x y].
- Case 2: Set
p = [x VMplotPos(2) y].
- Case 4: Set
p = [x y VMplotPos(3)].
- Otherwise: Set
p = [].
- If
p is not empty and u is true, update the VMplot with VMplot('',round(p)).
- Append the point
p to PL and the subplot index t to TL.
- If no output arguments are specified and
PL is not empty, plot the 3D result in subplot 3:
- Use
subplot(2,2,3) to select the subplot.
- Call
VLFLplotlight(1,0.5) to set lighting.
- Plot the points with
VLplot(PL,'b*-',5).
- Enable grid and 3D rotation, and label the axes.
Algorithm explaination created using ChatGPT on 2025-08-19 01:40. (Please note: No guarantee for the correctness of this explanation)
Last html export of this page out of FM database by TL: 2025-09-21