VMwindowplot
by Tim C. Lueth, SG-Lib Toolbox: SolidGeometry 5.6 - VM/Voxels
Introduced first in SolidGeometry 3.8, Creation date: 2017-04-12, Last change: 2025-09-14
plots a voxel model using the window caxis fnct
Description
shows only the voxels within the specified intensity interval and voxel intervall
See Also: VMplot
, VMcaxis
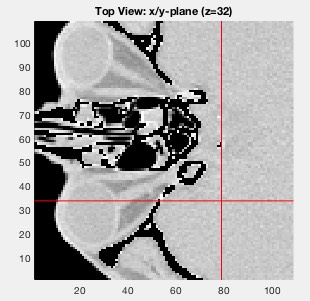
Example Illustration
Syntax
VX=VMwindowplot(V,[cax,minv,maxv])
Input Parameter
V: | | Voxel model |
cax: | | [cmin cmax]; |
minv: | | minimum voxel value; values <0 are precentage |
maxv: | | maximum voxel value; values <0 are precentage |
Output Parameter
Examples
VMwindowplot(V,[400 1200],0.2,0.7);
SGofVMmarchcube(VX)
Copyright 2017-2025 Tim C. Lueth. All rights reserved. The code is the property of Tim C. Lueth and may not be redistributed or modified without explicit written permission. This software may be used free of charge for academic research and teaching purposes only. Commercial use, redistribution, modification, or reverse engineering is strictly prohibited. Access to source code is restricted and granted only under specific agreements. For licensing inquiries or commercial use, please contact: Tim C. Lueth
Algorithm (Workflow)
This function, VMwindowplot, is designed to plot a voxel model using a specified intensity window. It filters and displays only the voxels within a given intensity range and voxel interval.
Input Parameters
- V: The voxel model, a 3D matrix representing the data to be visualized.
- cax: A two-element vector [cmin cmax] defining the intensity range for visualization. If not provided, it defaults to the minimum and maximum values within the selected voxel range.
- minv: The minimum voxel value. If less than 0, it is treated as a percentage of the voxel model's size. It can be a scalar or a three-element vector specifying the minimum indices in each dimension.
- maxv: The maximum voxel value. Similar to minv, if less than 0, it is treated as a percentage. It can also be a scalar or a three-element vector specifying the maximum indices in each dimension.
Output
- VX: The filtered voxel model, containing only the voxels within the specified intensity and voxel range.
Algorithm Steps
- Initialize default values for cax, minv, and maxv.
- Check if additional arguments are provided and update cax, minv, and maxv accordingly.
- If minv or maxv is a scalar and less than 1, convert it to a percentage of the voxel model's size.
- Ensure minv and maxv are three-element vectors, representing the minimum and maximum indices in each dimension.
- Extract the sub-volume of the voxel model V using the specified minv and maxv indices.
- Determine the default cax based on the minimum and maximum values within the extracted sub-volume VX.
- Update cax if a specific range is provided as an argument.
- Set voxels outside the specified cax range to zero.
- Plot the filtered voxel model VX using VMplot.
- Set the color axis for the plot using VMcaxis.
Algorithm explaination created using ChatGPT on 2025-08-19 06:44. (Please note: No guarantee for the correctness of this explanation)
Last html export of this page out of FM database by TL: 2025-09-21