matrixofCPL
by Tim C. Lueth, SG-Lib Toolbox: SolidGeometry 5.6 - PL/Point Lists
Introduced first in SolidGeometry 4.9, Creation date: 2020-01-09, Last change: 2025-09-14
simplified version of matrixdistanceofCPL
See Also: matrixdistanceofCPL
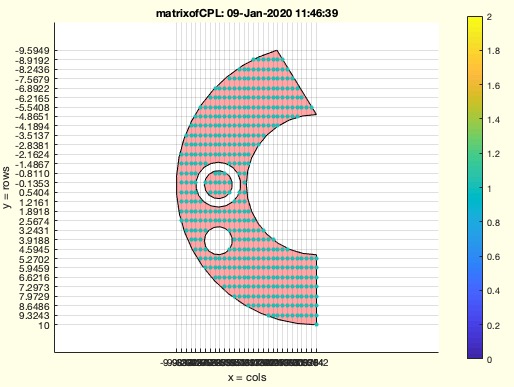
Example Illustration
Syntax
[M,GPL,ax]=matrixofCPL(CPL,[nrc])
Input Parameter
CPL: | | CPL |
nrc: | | [nx ny] or [dx dy] if [dx,dy]<10 mm |
Output Parameter
M: | | Matrix |
GPL: | | Grid Point Coordinates |
ax: | | [xmin xmax ymin ymax] |
Examples
matrixofCPL(CPLsample(29));
Copyright 2020-2025 Tim C. Lueth. All rights reserved. The code is the property of Tim C. Lueth and may not be redistributed or modified without explicit written permission. This software may be used free of charge for academic research and teaching purposes only. Commercial use, redistribution, modification, or reverse engineering is strictly prohibited. Access to source code is restricted and granted only under specific agreements. For licensing inquiries or commercial use, please contact: Tim C. Lueth
Algorithm (Workflow)
This function, matrixofCPL, is a simplified version of matrixdistanceofCPL and is part of the SolidGeometry library. It processes closed polygon lists (CPL) to generate a matrix representation.
Input Parameters
- CPL: A closed polygon list that defines the shape or area to be processed.
- nrc: An optional parameter that can be either a vector [nx ny] specifying the number of grid points in x and y directions, or [dx dy] specifying the grid spacing in x and y directions if both values are less than 10 mm.
Output Results
- M: A matrix representing the grid where the CPL is defined. Non-NaN values in the matrix are set to 1.
- GPL: Grid Point Coordinates, which are the coordinates of the grid points used in the matrix.
- ax: A vector [xmin xmax ymin ymax] defining the axis limits of the grid.
Algorithm Steps
- The function begins by calling
matrixdistanceofCPL with the CPL and any additional parameters provided in varargin. This function returns a matrix M, grid point coordinates GPL, an insout array, and axis limits ax.
- All non-NaN values in the matrix
M are set to 1, effectively creating a binary representation of the CPL.
- If no output arguments are specified, the function will plot the results:
- It creates a new figure using
SGfigure.
- The CPL is plotted in red using
CPSplot.
- Grid points inside the CPL are plotted using
VLscatter, with a color bar to indicate values.
- The matrix
M is plotted using matrixplot with the axis limits ax.
Algorithm explaination created using ChatGPT on 2025-08-18 23:05. (Please note: No guarantee for the correctness of this explanation)
Last html export of this page out of FM database by TL: 2025-09-21