matrixplot
by Tim C. Lueth, SG-Lib Toolbox: SolidGeometry 5.6 - VM/Voxels
Introduced first in SolidGeometry 4.8, Creation date: 2019-11-23, Last change: 2025-09-14
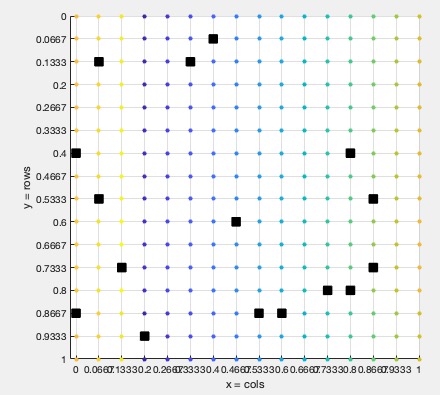
plots a 2D matrix as grid point list with coordinates
Description
will be extended in future for 3D grids
add a colorbar if desired
use colormap(jet) to see extrem values better
NaN is plotted as square
See Also: ELdistanceofmatrixneighbors
, VMofVL
, matrixneighbors
, matrixvalues
, matrixdistancefield
Example Illustration
Syntax
h=matrixplot(M,[flpud,ax,txtsize,plotnan])
Input Parameter
M: | | Matrix (n x m) |
flpud: | | flipud for rows values; default is true |
ax: | | [xmin xmax ymin ymax]; default is [1 size(M,2) 1 size(M,1)] |
txtsize: | | text size; default is 0; |
plotnan: | | true => nan plotted as square; default is false |
Output Parameter
h: | | handle to graphics objects |
Examples
m=16; M=circshift(reshape(1:m*m,m,[]),[floor(randminv(m)),floor(randminv(m))])
n=m; for i=1:n; M(floor(randminv(m)),floor(randminv(m)))=nan; end; M
close all; figure; view(0,90); matrixplot(M), axis equal
close all; figure; view(0,90); matrixplot(M,'',[0 1 0 1]), axis equal
 close all; figure; view(0,90); matrixplot(M,'',[0 1 0 1],'',true), axis equal
Copyright 2019-2025 Tim C. Lueth. All rights reserved. The code is the property of Tim C. Lueth and may not be redistributed or modified without explicit written permission. This software may be used free of charge for academic research and teaching purposes only. Commercial use, redistribution, modification, or reverse engineering is strictly prohibited. Access to source code is restricted and granted only under specific agreements. For licensing inquiries or commercial use, please contact: Tim C. Lueth
Last html export of this page out of FM database by TL: 2025-09-21