by Tim C. Lueth, SG-Lib Toolbox: SolidGeometry 5.6 - Auxiliary function
Introduced first in SolidGeometry 5.1, Creation date: 2021-08-12, Last change: 2025-09-15
See Also: , meanGauss
T=meanT(TL)
TL: | cell list or numerical sequence of 4x4 matrices |
T: | mean value of a set of HT Matrices |
This algorithm calculates the mean value of a set of homogeneous transformation (HT) matrices. It is designed to handle both cell lists and numerical sequences of 4x4 matrices.
If the input TL is a numeric array, it is converted into a cell list. This is done by dividing the array into 4x4 matrices using the mat2cell function. The function repmat(4, size(TL,1)/4, 1) is used to specify the size of each cell.
The first matrix in the cell list TL is assigned to T as the initial mean matrix.
A loop iterates over the matrices in TL starting from the second matrix. Each matrix is added to T.
The sum of matrices stored in T is divided by the number of matrices to compute the mean.
The first three columns of the resulting mean matrix T are normalized to ensure they represent valid rotation vectors. This is done by dividing each column by its norm.
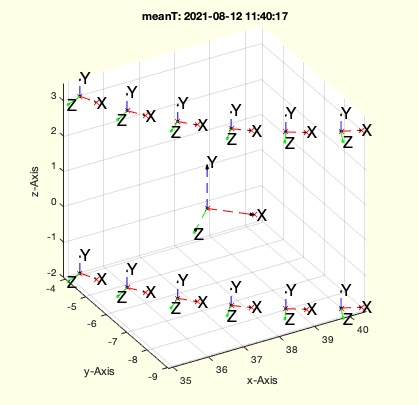
If no output is requested (i.e., nargout==0), the function visualizes the transformation matrices. It reshapes the fourth column of each matrix into a set of vectors VL and uses functions sofBB, BBofVL, SGfigure, and tplot to plot the original and mean matrices.