by Tim C. Lueth, SG-Lib Toolbox: SolidGeometry 5.6 - User interface
Introduced first in SolidGeometry 3.4, Creation date: 2017-02-23, Last change: 2025-08-19
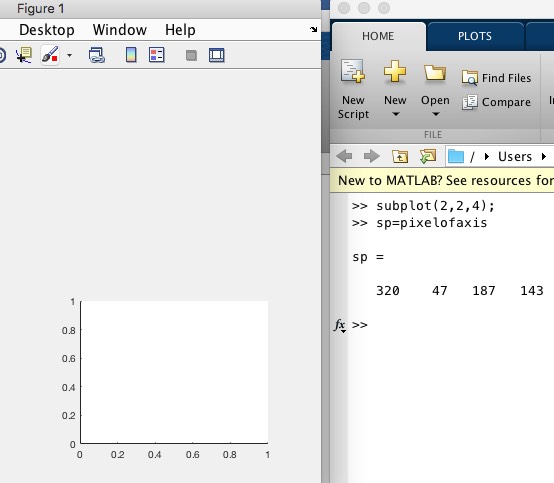
sp=pixelofaxis
sp: | [left bottom size-x size-y] |
subplot(2,2,4);
sp=pixelofaxis
uicontrol('Style', 'popup','String', {'R-Joint','P-Joint','G-Joint'},'Position', sp)This function, pixelofaxis, calculates the pixel position of the current axis within a figure in MATLAB. It is particularly useful for placing UI control objects relative to subplots.
The function does not take any input parameters.
sp: A vector representing the position and size of the axis in the format [left, bottom, size-x, size-y].p0: A vector representing the offset of the axis in the x and y directions.ff: A vector representing the scaling factors for the x and y directions.get(gcf,'Position') and store it in fs.get(gca,'Position') and store it in ss.dx) and height (dy) of the figure from fs.sp. This is done by scaling the axis position ss with the figure dimensions dx and dy.axis and calculate the range in the x (dx) and y (dy) directions.fx and fy for the x and y directions, respectively, by dividing the axis size in pixels by the axis range.x0 and y0 for the axis in the x and y directions, respectively, by dividing the negative pixel position by the scaling factors.p0 and the scaling factors in ff.The function can be used to position a UI control relative to a subplot:
subplot(2,2,4);
sp = pixelofaxis;
uicontrol('Style', 'popup', 'String', {'R-Joint', 'P-Joint', 'G-Joint'}, 'Position', sp);
Algorithm explaination created using ChatGPT on 2025-08-19 00:07. (Please note: No guarantee for the correctness of this explanation)