by Tim C. Lueth, SG-Lib Toolbox: SolidGeometry 5.6 - User interface
Introduced first in SolidGeometry 3.6, Creation date: 2017-03-09, Last change: 2025-09-14
t=plotannotation(str,[position])
str: | string or cell with separated strings | |
position: | Vtop, Vmiddle, Vdown, Hright, Hmiddle, Hleft, left, right, center |
t: | handle to annotation box |
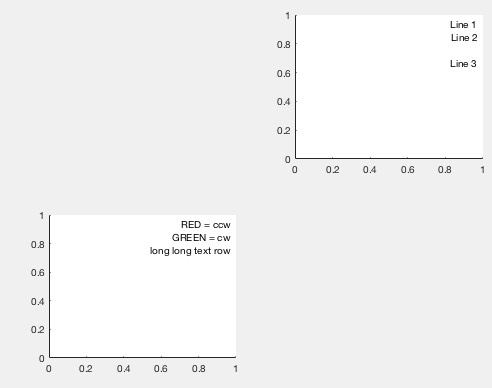
subplot(2,2,3);
t=plotannotation({'RED = ccw','GREEN = cw','long long text row'},'linestyle','none');
subplot(2,2,2);
t=plotannotation('Line 1\n Line 2\n\nLine 3','linestyle','none');
t=plotannotation('Line 1\n Line 2\n\nLine 3','linestyle','none','Vdown','Hmiddle','left'); shg