BBaddtolerance
by Tim C. Lueth, SG-Lib Toolbox: SolidGeometry 5.6 - Auxiliary function
Introduced first in SolidGeometry 4.9, Creation date: 2020-01-11, Last change: 2025-09-14
increases the size of a Boundary Box
Description
in contrast to BBgrow, this function BBaddtolerance adds a tolerance and does not magnify the BB.
this function is able to handle lists of BBs
See Also: , BBofSG
, BBgrow
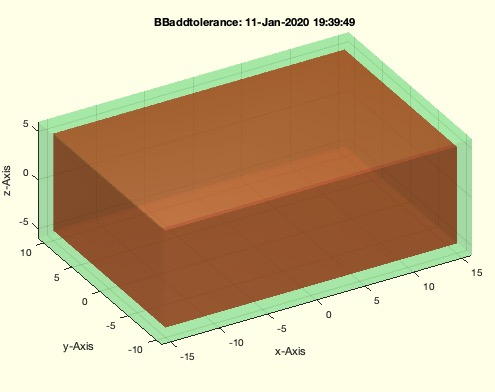
Example Illustration
Syntax
BBG=BBaddtolerance(BB,[tol])
Input Parameter
BB: | | bounding box or axis |
tol: | | growing size |
Output Parameter
Examples
BBaddtolerance(BBofCPL(PLcircle(4)),1)
BBaddtolerance(BBofSG(SGbox),1)

BBgrow(BBofCPL(PLcircle(4)),1)
BBgrow(BBofSG(SGbox),1)
Copyright 2020-2025 Tim C. Lueth. All rights reserved. The code is the property of Tim C. Lueth and may not be redistributed or modified without explicit written permission. This software may be used free of charge for academic research and teaching purposes only. Commercial use, redistribution, modification, or reverse engineering is strictly prohibited. Access to source code is restricted and granted only under specific agreements. For licensing inquiries or commercial use, please contact: Tim C. Lueth
Algorithm (Workflow)
This function, BBaddtolerance, is designed to increase the size of a bounding box (BB) by adding a specified tolerance. It does not magnify the bounding box but simply adds a tolerance to its dimensions. The function can handle lists of bounding boxes.
Input Parameters
- BB: The bounding box or axis. It is expected to be a matrix where each row represents a bounding box.
- tol: The tolerance value to be added to the bounding box. It is an optional parameter, and if not provided, a default value of 1e-5 is used.
Output
- BBG: The new bounding box with the added tolerance.
Algorithm Steps
- The function starts by retrieving the tolerance value using
getfuncparams. If no tolerance is provided, it defaults to 1e-5.
- It checks the number of columns in the input bounding box
BBL to determine if it is a 3D or 2D bounding box.
- If
BBL has 6 columns, it is treated as a 3D bounding box. The function subtracts the tolerance from the minimum coordinates (columns 1, 3, 5) and adds the tolerance to the maximum coordinates (columns 2, 4, 6).
- If
BBL has fewer columns, it is treated as a 2D bounding box. The function performs similar operations on the 2D coordinates (columns 1, 3 for min and 2, 4 for max).
- If no output is requested (i.e.,
nargout==0), the function visualizes the original and modified bounding boxes using SGfigure and SGplotalpha. The original bounding box is plotted in red, and the modified bounding box is plotted in green.
Algorithm explaination created using ChatGPT on 2025-08-19 01:01. (Please note: No guarantee for the correctness of this explanation)
Last html export of this page out of FM database by TL: 2025-09-21