CPLaddauxpoints
by Tim Lueth & Christina Hein, SG-Lib Toolbox: SolidGeometry 5.6 - CPL/Closed Polygon Lists
Introduced first in SolidGeometry 3.6.1, Creation date: 2017-03-27, Last change: 2025-09-14
add supporting points to embedded CPL to guarantee a specified points distance
See Also: SGofCPLzdelaunayGrid
, PLFLofCPLdelaunayGrid
, RLdelauxpoints
, PLELaddauxpoints
, RLaddauxpoints
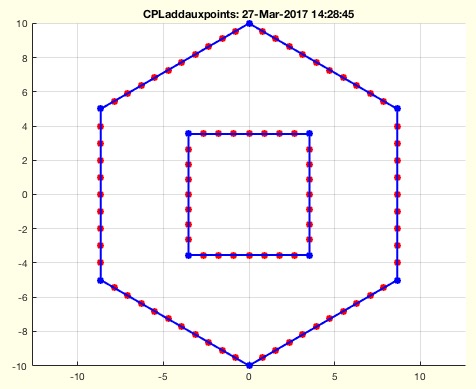
Example Illustration
Syntax
CPLN=CPLaddauxpoints(CPL,d)
Input Parameter
CPL: | | Closed Polygon List |
d: | | maximum distance between two points |
Output Parameter
CPLN: | | New Closed Polygon List |
Examples
CPLaddauxpoints([PLcircle(10,6);NaN NaN; PLcircle(5,4)],1)
CPLaddauxpoints(CPLsample(12),1)
Copyright 2017-2025 Tim C. Lueth. All rights reserved. The code is the property of Tim C. Lueth and may not be redistributed or modified without explicit written permission. This software may be used free of charge for academic research and teaching purposes only. Commercial use, redistribution, modification, or reverse engineering is strictly prohibited. Access to source code is restricted and granted only under specific agreements. For licensing inquiries or commercial use, please contact: Tim C. Lueth
Algorithm (Workflow)
This function, CPLaddauxpoints, is designed to add supporting points to a Closed Polygon List (CPL) to ensure that the distance between any two consecutive points does not exceed a specified maximum distance, d.
Input Parameters
- CPL: A Closed Polygon List, which is a list of 2D points representing the vertices of a closed polygon.
- d: The maximum allowable distance between two consecutive points in the polygon.
Output
- CPLN: A new Closed Polygon List with additional points inserted to satisfy the distance constraint.
Algorithm Steps
- Initialize an empty list
CPLN to store the new polygon points.
- Ensure
CPL only contains the first two columns, representing x and y coordinates.
- Use the function
separateNaN to determine the number of separate polygons within CPL by identifying NaN separators.
- Iterate over each separate polygon segment:
- Extract the
i-th polygon segment using separateNaN(CPL,i).
- Call
RLaddauxpoints on this segment to add auxiliary points, ensuring no segment exceeds the distance d.
- Append the processed segment and a
NaN NaN separator to CPLN.
- Remove the last
NaN NaN separator from CPLN.
- If no output is requested (
nargout==0), plot the original and modified polygons for visual comparison:
- Use
SGfigure to create a new figure and set the view to top-down (0,90).
- Plot the modified polygon
CPLN in red with stars and lines.
- Plot the original polygon
CPL in blue with stars and lines.
Algorithm explaination created using ChatGPT on 2025-08-19 01:00. (Please note: No guarantee for the correctness of this explanation)
Last html export of this page out of FM database by TL: 2025-09-21