CPLconcat
by Tim C. Lueth, SG-Lib Toolbox: SolidGeometry 5.6 - CPL/Closed Polygon Lists
Introduced first in SolidGeometry 4.9.1, Creation date: 2020-08-27, Last change: 2025-09-14
returns a simple concatenation of CPls
Description
simply based on [A;nan nan;B]
without an simplificatin of a polyshape
See Also: CPLbool
, CPLsubtract
, CPLunion
, CPLintersect
, CPLxor
Example Illustration
Syntax
CPL=CPLconcat(A,B,[]);
Input Parameter
Output Parameter
Examples
CPLconcat(PLcircle(10,6),PLcircle(5,6)+[7 0]);
CPLconcat (CPLsample(4), {CPLsample(8),CPLsample(3)},'ontop','right');
Copyright 2020-2025 Tim C. Lueth. All rights reserved. The code is the property of Tim C. Lueth and may not be redistributed or modified without explicit written permission. This software may be used free of charge for academic research and teaching purposes only. Commercial use, redistribution, modification, or reverse engineering is strictly prohibited. Access to source code is restricted and granted only under specific agreements. For licensing inquiries or commercial use, please contact: Tim C. Lueth
Algorithm (Workflow)
This function, CPLconcat, is designed to concatenate two closed polygon lists (CPLs) in MATLAB. It is part of the SolidGeometry library and was introduced by Tim Lueth.
Input Parameters
- A: The first closed polygon list (CPL).
- B: The second closed polygon list (CPL). It can be a single CPL or a cell array of CPLs.
- varargin: Optional parameters that specify relative transformations between CPLs.
Output
- CPL: The resulting concatenated closed polygon list.
Algorithm Steps
- Check if
B is a cell array:
- If
B is a cell array, initialize CPL with A.
- Iterate over each element in
B:
- Transform each element
B{i} relative to A using CPLtransrelCPL with any additional parameters from varargin.
- Concatenate the transformed
B{i} with CPL using a recursive call to CPLconcat.
- If
B is not a cell array:
- Check if there are any relative transformations specified in
varargin:
- If so, transform
B relative to A using CPLtransrelCPL.
- Check if
B is empty:
- If
B is empty, set CPL to A.
- Check if
A is empty:
- If
A is empty, set CPL to B.
- If neither
A nor B is empty, concatenate them with a row of nan nan in between to form CPL.
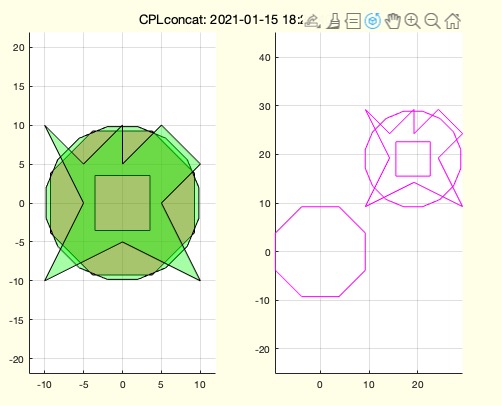
- If no output is requested (
nargout == 0), plot the results:
- Use
SGfigure to create a figure with two subplots.
- Plot
A in red and B in green in the first subplot.
- Plot the resulting
CPL in magenta in the second subplot.
- Ensure all plots have equal axis scaling, grid on, and a view angle of (0, 90).
- Use
SGtitle to add a title to the figure.
Algorithm explaination created using ChatGPT on 2025-08-19 06:48. (Please note: No guarantee for the correctness of this explanation)
Last html export of this page out of FM database by TL: 2025-09-21