CPLunion
by Tim C. Lueth, SG-Lib Toolbox: SolidGeometry 5.6 - Boolean
Introduced first in SolidGeometry 4.9, Creation date: 2020-07-20, Last change: 2025-09-14
returns a Boolean addition of 2 CPLs
Description
simply based on CPLbool
CPLadd works different and protects all hole in the CPLs
See Also: CPLadd
, CPLbool
, CPLsubtract
, CPLintersect
, CPLxor
, CPLconcat
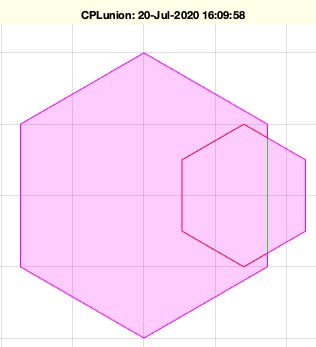
Example Illustration
Syntax
CPL=CPLunion(A,B,[sr])
Input Parameter
A: | | CPL A |
B: | | CPL B |
sr: | | spatial relation for CPLtransrelCPL |
Output Parameter
Examples
CPLunion(PLcircle(10,6),PLcircle(5,6)+[7 0]);
CPLunion(PLcircle(10,6),{PLcircle(5,6)+[7 0], PLstar(3)});
Copyright 2020-2025 Tim C. Lueth. All rights reserved. The code is the property of Tim C. Lueth and may not be redistributed or modified without explicit written permission. This software may be used free of charge for academic research and teaching purposes only. Commercial use, redistribution, modification, or reverse engineering is strictly prohibited. Access to source code is restricted and granted only under specific agreements. For licensing inquiries or commercial use, please contact: Tim C. Lueth
Algorithm (Workflow)
This function, CPLunion, performs a Boolean union operation on two Closed Polygon Lists (CPLs), A and B. It is part of the SolidGeometry library and is designed to handle geometric operations on polygonal shapes.
Input Parameters
- A: The first Closed Polygon List (CPL).
- B: The second Closed Polygon List (CPL). It can be a single CPL or a cell array of CPLs.
- sr: An optional spatial relation parameter used for transforming B relative to A.
Output
- CPL: The resulting CPL after performing the Boolean union operation.
Algorithm Steps
- Check if B is a cell array:
- If true, initialize CPL with A.
- Iterate over each element in B:
- Transform each element
B{i} relative to A using CPLtransrelCPL with the spatial relation parameter.
- Perform a Boolean union operation using
CPLbool with the '+' operator on CPL and the transformed B{i}.
- If B is not a cell array:
- Check if the spatial relation parameter is provided. If so, transform B relative to A using
CPLtransrelCPL.
- Perform a Boolean union operation using
CPLbool with the '+' operator on A and B.
- If no output is requested (i.e.,
nargout==0), visualize the result:
- Open a new figure and set the view to a top-down perspective.
- Plot A in green.
- Plot B in red. If B is a cell array, iterate and plot each element.
- Plot the resulting CPL in magenta.
- Use
CPSplot to add additional visualization details to the resulting CPL.
Algorithm explaination created using ChatGPT on 2025-08-19 06:56. (Please note: No guarantee for the correctness of this explanation)
Last html export of this page out of FM database by TL: 2025-09-21