CPLcontourc
by Tim C. Lueth, SG-Lib Toolbox: SolidGeometry 5.6 - CPL/Closed Polygon Lists
Introduced first in SolidGeometry 3.6, Creation date: 2017-03-18, Last change: 2025-09-14
returns the CPL of matlab's contourc command
Description
This function simply calls contourc and converts the output matrix into CPL format.
For the properties of the contour matrix result read the help for ContourMatrix
ATTENTION: The original ContourMatrix supports open and closed PL!
ATTENTION: The original ContourMatrix has many points on a staight line!
Automatically converts the type into the requested double format.
See Also: PLofimcontourc
, CVLofcontourc
, CPLofcontourc
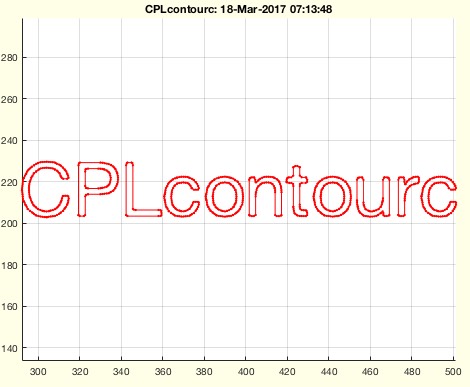
Example Illustration
Syntax
CPL=CPLcontourc([Inputparameter])
Input Parameter
Inputparameter: | | exactly the parameter same as contourc |
Output Parameter
Examples
figure; axis off; text(0.5,0.5,'This is a Test', 'FontSize',36)
I=getframe(gcf); I=flipud(I.cdata(:,:,1));
CPLcontourc(I,1);
Copyright 2017-2025 Tim C. Lueth. All rights reserved. The code is the property of Tim C. Lueth and may not be redistributed or modified without explicit written permission. This software may be used free of charge for academic research and teaching purposes only. Commercial use, redistribution, modification, or reverse engineering is strictly prohibited. Access to source code is restricted and granted only under specific agreements. For licensing inquiries or commercial use, please contact: Tim C. Lueth
Algorithm (Workflow)
This function, CPLcontourc, is designed to convert the output of MATLAB's contourc command into a Closed Polygon List (CPL) format. It is part of the SG-Library and was created by Tim Lueth in 2017.
Input Parameters
- Inputparameter: This is the same as the input parameters for the
contourc function. It typically includes a matrix of data and optional contour levels.
Output Results
- CPL: The function returns a Closed Polygon List, which is a format that represents closed contours.
Algorithm Steps
- The function begins by calling the
contourc function with the input parameters. The first parameter is converted to a double precision format using double(varargin{1}), and any additional parameters are passed as they are.
- The result from
contourc is stored in the variable C.
- The function
CPLofcontourc is then called with C and a boolean true to convert the contour matrix into a Closed Polygon List (CPL).
- If no output argument is specified (i.e.,
nargout==0), the function will automatically plot the CPL using the following steps:
- It calls
SGfigure to create a new figure.
- Sets the view to a 2D plane with
view(0,90).
- Enables the axis and grid with
axis on and grid on.
- Sets the title of the plot using
title(titleofcaller).
- Plots the CPL using
CPLplot(CPL,'r.-'), which uses red color and marks the points with dots.
Example Usage
The example provided in the code demonstrates how to use the function:
figure; axis off; text(0.5,0.5,'This is a Test', 'FontSize',36)
I=getframe(gcf); I=flipud(I.cdata(:,:,1));
CPLcontourc(I,1);
This example creates a figure with text, captures the frame, processes the image data, and then calls CPLcontourc to generate and plot the contours.
Algorithm explaination created using ChatGPT on 2025-08-19 06:51. (Please note: No guarantee for the correctness of this explanation)
Last html export of this page out of FM database by TL: 2025-09-21