by Tim C. Lueth, SG-Lib Toolbox: SolidGeometry 5.6 - CPL/Closed Polygon Lists
Introduced first in SolidGeometry 5.1, Creation date: 2021-12-05, Last change: 2025-09-15
See Also: crossC2P
, CPLofPLcrossCPL
CPLX=CPLcrossline(CPL,PL,[acc]);
CPL: | CLosed polygon region | |
PL: | Point list | |
acc: | accuracy, line thickness; default is 0.01 |
CPLX: | Crossing Area |
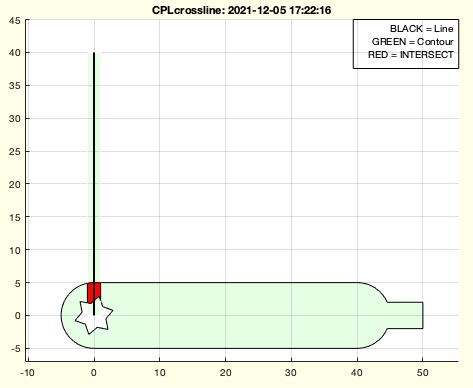
CPLcrossline(CPLsample(37),[0 0;0 10],1)This function, CPLcrossline, calculates the intersection of a closed polygon list (CPL) with a line defined by a point list (PL). It is part of the SolidGeometry library.
acc, using the getfuncparams function. If acc is not provided, it defaults to 0.1.PL is converted to its real component using real(PL), ensuring it is in a suitable format for further processing.PLgrowline is called with PL and acc to create a grown line, CPLB, which represents the line with a specified thickness.CPL and the grown line CPLB is calculated using the function CPLintersect, resulting in CPLX.nargout==0), the function proceeds to visualize the results:SGfigure is called to create a new figure for plotting.CPSplot is used to plot the closed polygon CPL in green with a line thickness of 0.1.CPSplot is used again to plot the grown line CPLB in green with a white edge.CPSplot is used to plot the intersection area CPLX in red with a line thickness of 1.PLplot is used to plot the original line PL in black with a line thickness of 2.plotannotation is called to add a legend to the plot, indicating the colors and their corresponding elements.