CPLplotasPSplain
by Tim C. Lueth, SG-Lib Toolbox: SolidGeometry 5.6 - Visualization
Introduced first in SolidGeometry 5.6, Creation date: 2025-09-13, Last change: 2025-09-15
Plots each individual embedded CPL as a separate contour.
Use carefully: The 'CPLplotasPSplain' function has not yet been extensively tested
Description
Due to the constant expansion of polyshape, it is necessary to have functions that can still clearly represent the underlying CPL before a simplify (split point separation), orientation change, or removal of collinear points occurs by default.
See Also: CPLplotasPS
, CPSplot
, CPLplothatched
Example Illustration
Syntax
h=CPLplotasPSplain(CPL)
Input Parameter
CPL: | | CPL with nan separated CPLi |
Output Parameter
Examples
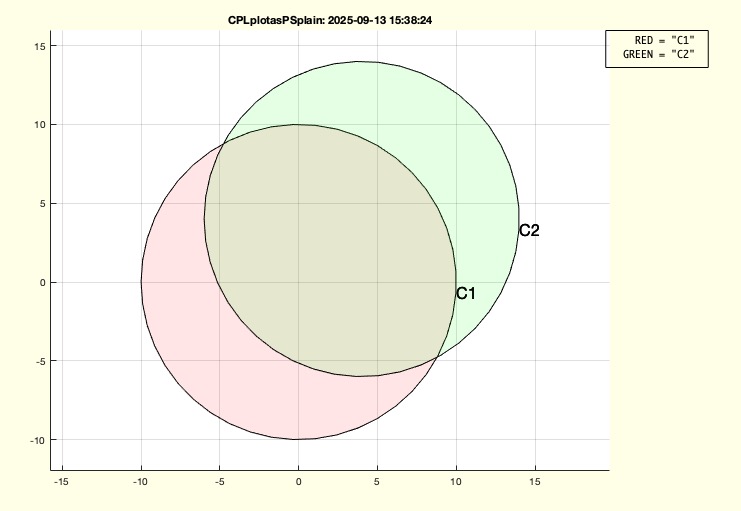
CPL=[PLcircle(10);nan nan;PLcircle(10)+4];
SGfigure; CPLplotasPSplain(CPL);
SGfigure; CPLplotasPSplain(CPLsample(47));
Copyright 2025 Tim C. Lueth. All rights reserved. The code is the property of Tim C. Lueth and may not be redistributed or modified without explicit written permission. This software may be used free of charge for academic research and teaching purposes only. Commercial use, redistribution, modification, or reverse engineering is strictly prohibited. Access to source code is restricted and granted only under specific agreements. For licensing inquiries or commercial use, please contact: Tim C. Lueth
Last html export of this page out of FM database by TL: 2025-09-21