animatego | rotates one or several objects in a loop | 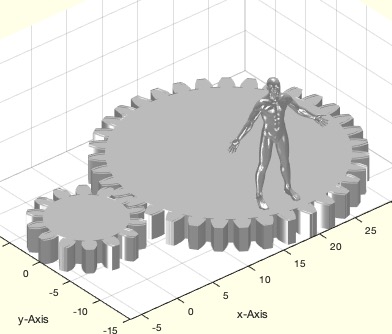 |
apptogglelighttrans | toogles thes VLFLplotligh status from facets to light |  |
axesofgcf | returns the handles to the axis | 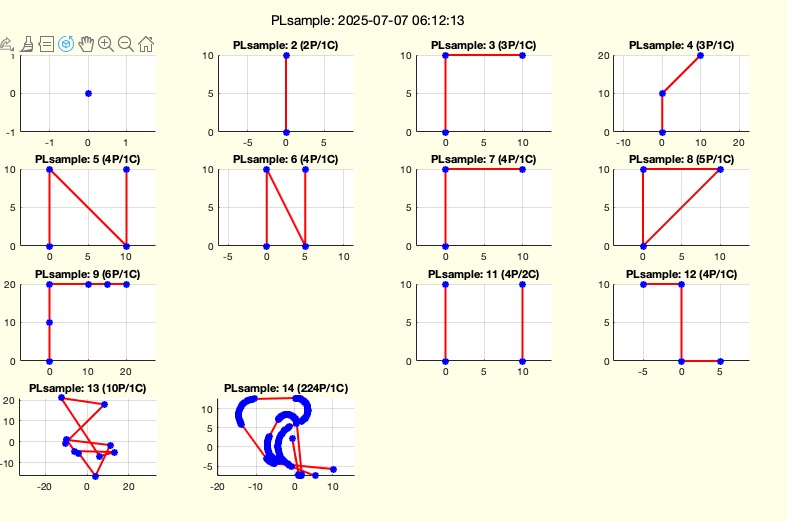 |
axis4all | applies the commands for axis to all subplots applies the commands for axis to all subplots | 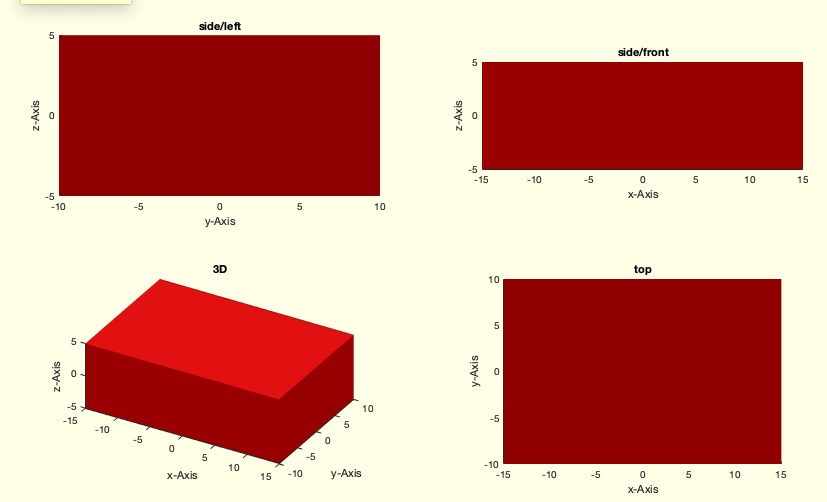 |
axis4animation | automatically increases but never decreases the axis area | 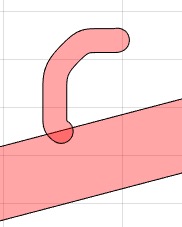 |
axisAIM | Just sets some figure values for the AIM Book von Tim Lueth and Mattias Traeger | 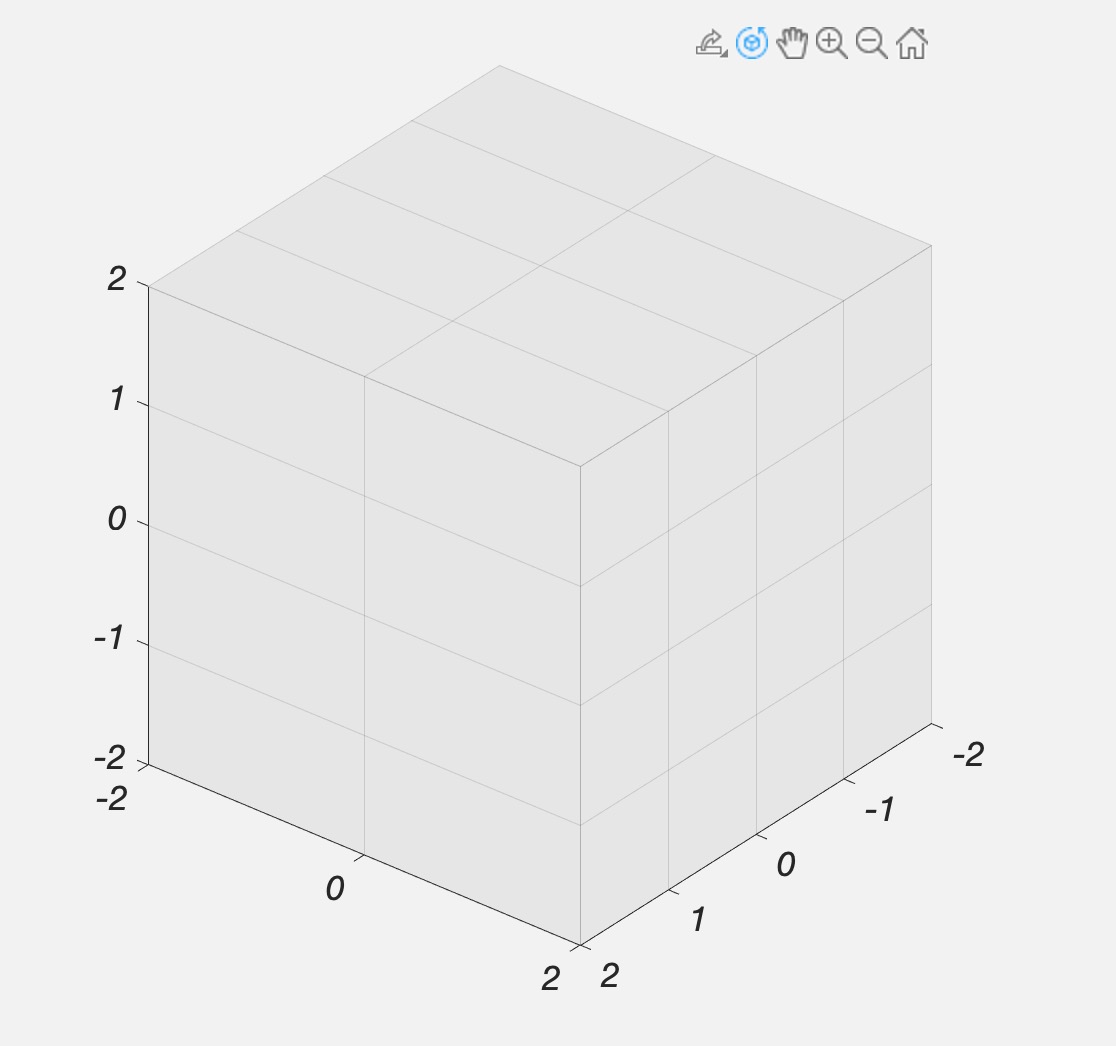 |
axisratio | returns the axis ratio x y z | 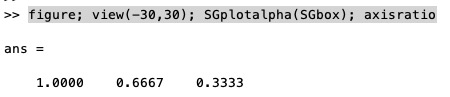 |
axisscale | scales the axis to a defined size | 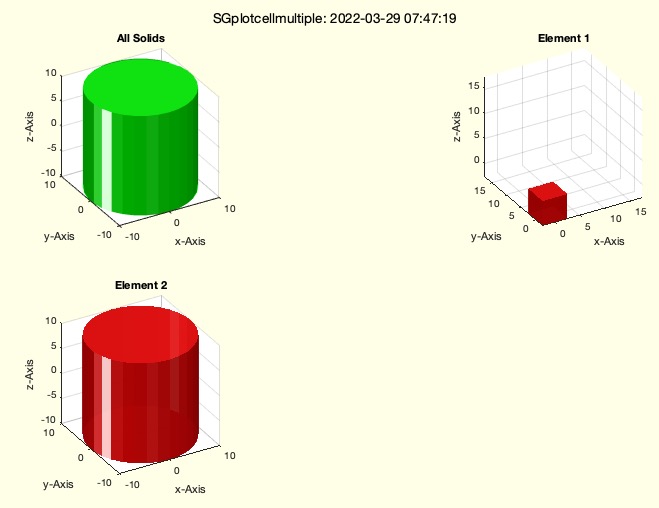 |
bplot | plots grid boxes at a desired position | 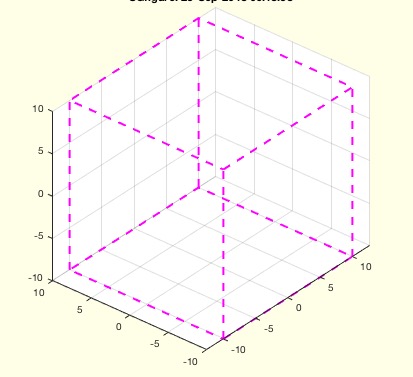 |
camangle | sets the camera angle and edjust the distance so that there is almost no change in the image | 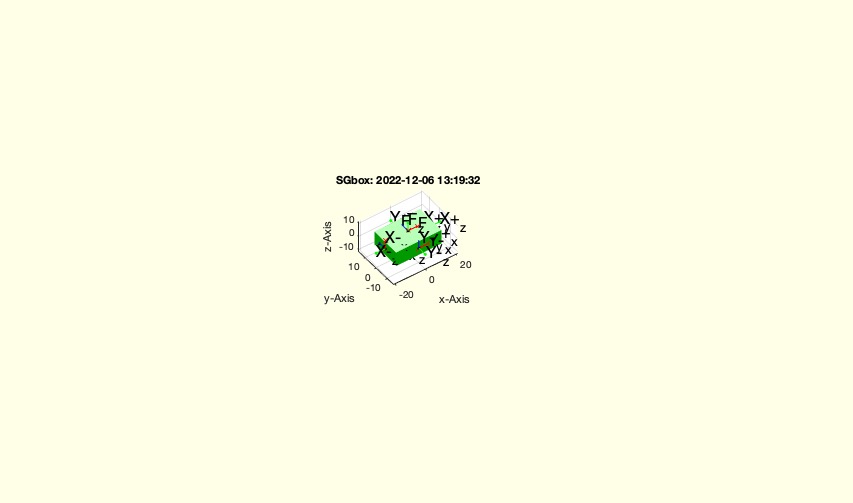 |
camlightdelete | just removes all camlighs in a gca |  |
camlightTL | deletes all camlights and set three new | 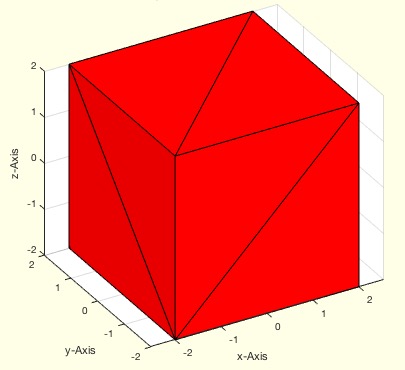 |
camofT | set camera to look on a given HT matrix using current zoom |  |
camofVLFLfi | shows to a specific facet for inspecting a facet of interest | 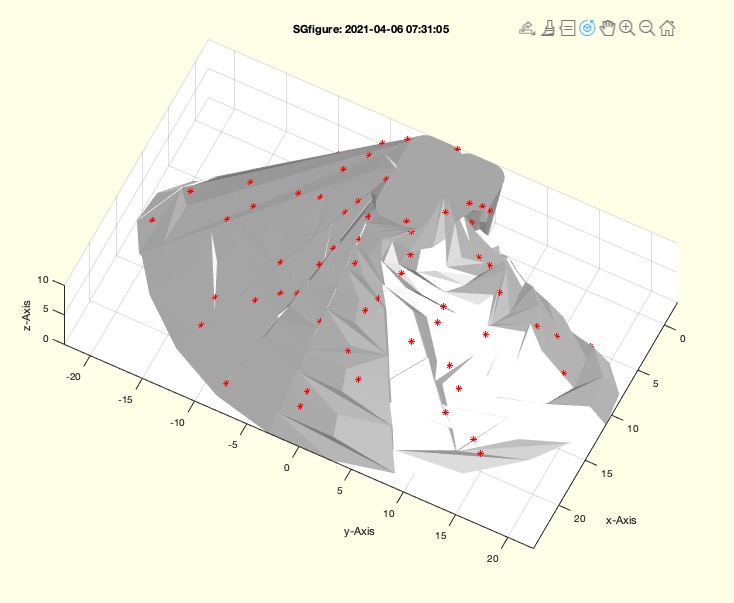 |
camplot | plots a line of the current camera position in the axis | 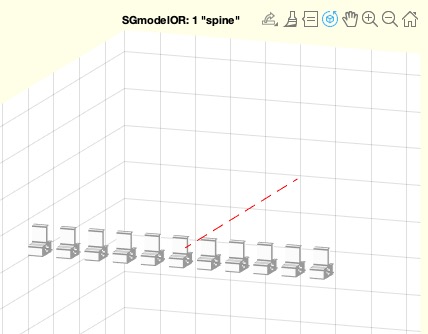 |
char2rgb | returns a RGB value from a color character | 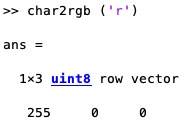 |
col2RGB | generates a colorvector from the colorchar | 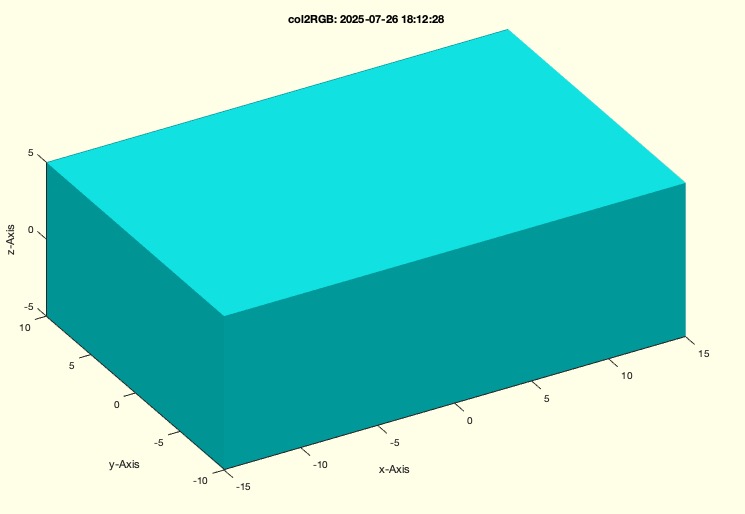 |
color | generates a colorvector from the colorchar | 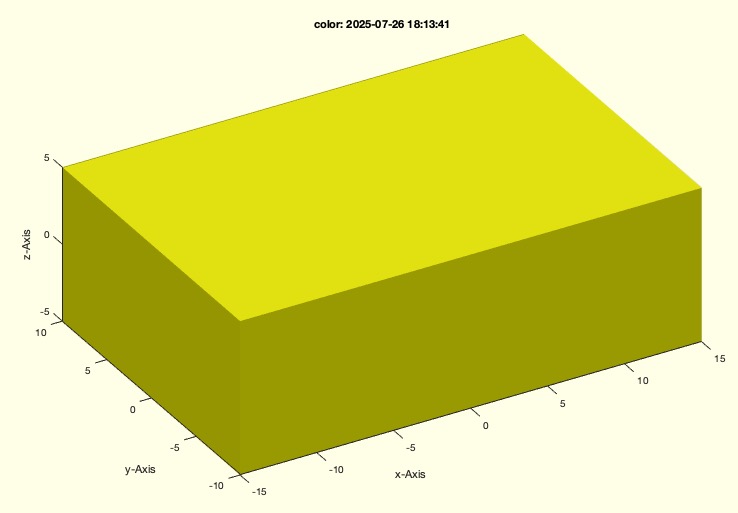 |
colorname | returns a name for a color string or a cell list of colstrings | 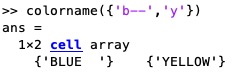 |
cplot | Plots a list of circle segments | 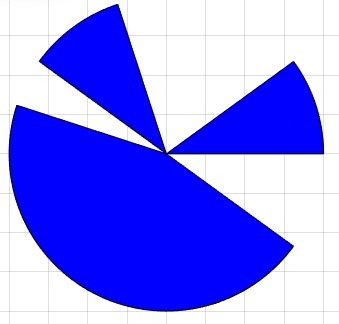 |
CPLplot | plots a 2D polybool contour polygon in a 3D figure | 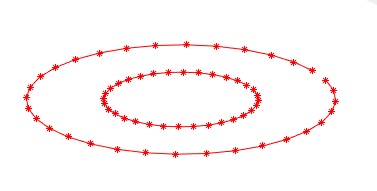 |
CPLplotasPSplain | Plots each individual embedded CPL as a separate contour. | 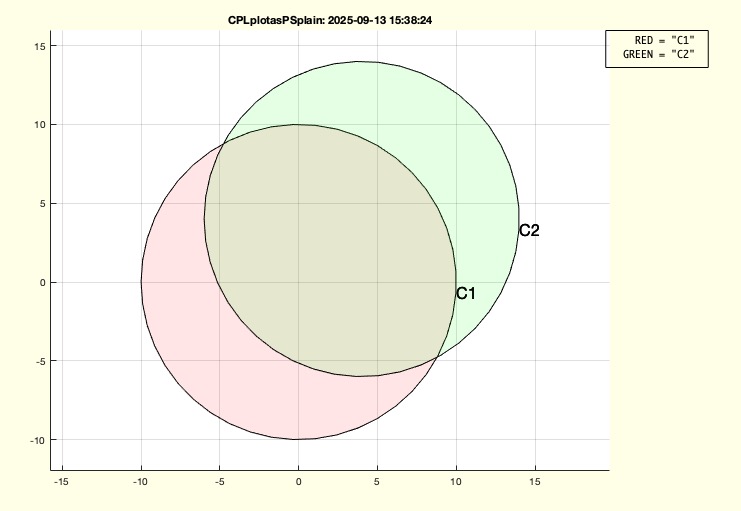 |
CPLplothatched | plots a CPL including hatch | 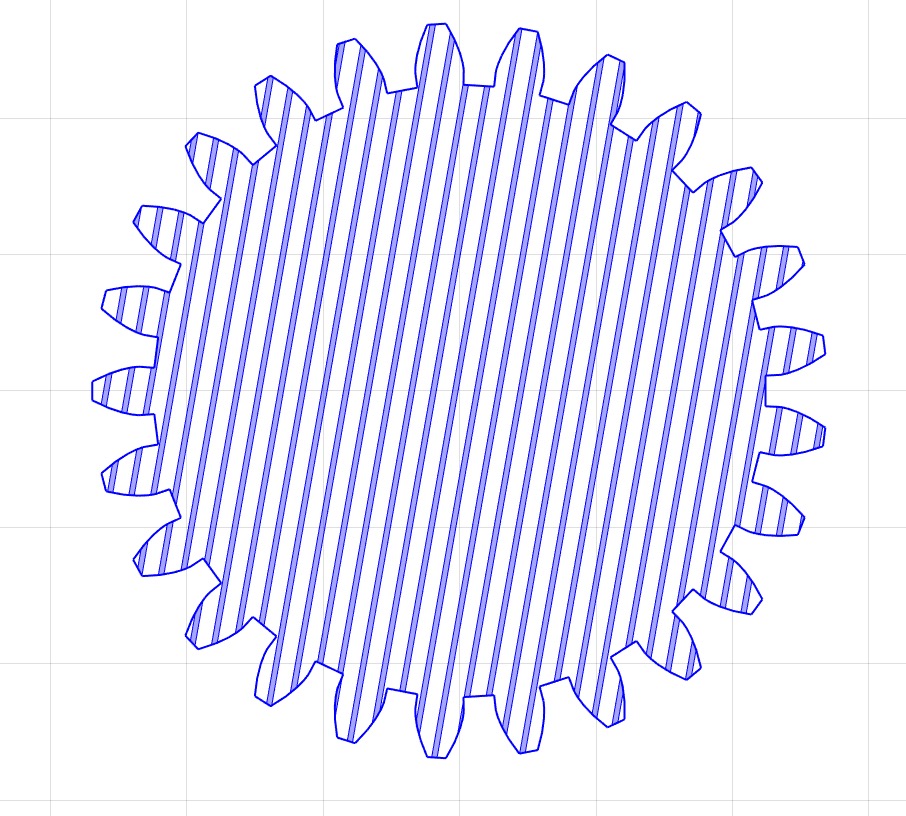 |
CVLplot | plots a 2D polybool contour polygon in a 3D figure | 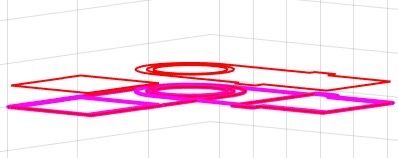 |
CVLplots | similar to CVLplot but shows optionally the direction of the line segments | 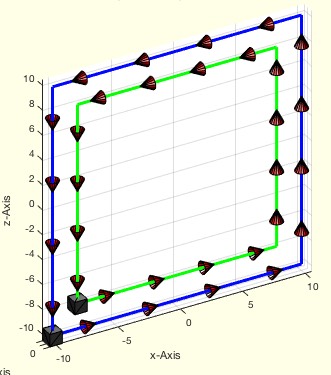 |
CVLplotsurface | plots a planar CVL as surface | 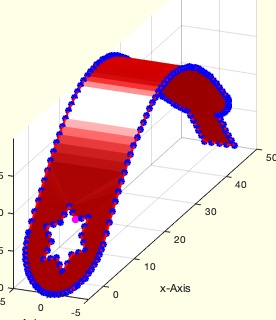 |
CVLzplotasCPS | similar to CVLplot but separates the z values just in case somebody forgot nan nan | 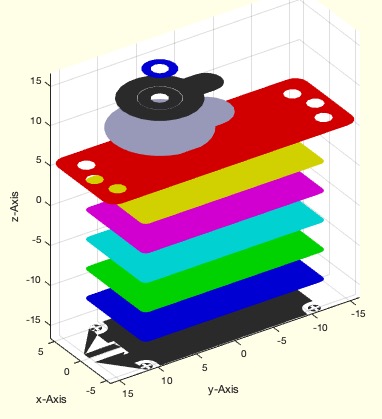 |
CVLzplotui | interactive editor to scroll throu a stack of slices | 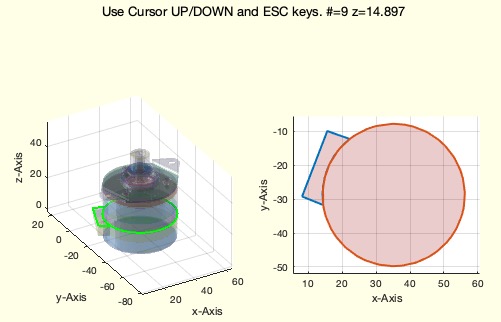 |
deleteQuiver | deletes all Quivers (coordinate graphics objects) in the named axes |  |
drawnowvid | this fnct is an auxilary fnct to automate the creation of videos |  |
FEplot | plots the featureEdges of TR, SG or VLFL |  |
figcopyright | draws a copyright marker inside of the current figure |  |
figsize | sets the figure size | 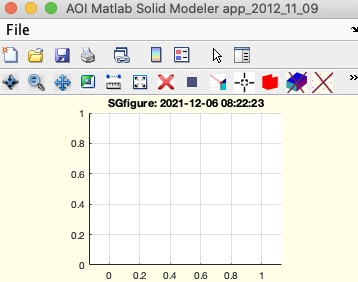 |
figureisopen | returns of there is already a graphics window open |  |
figurerotate | rotates the current figure to show 3D effects | 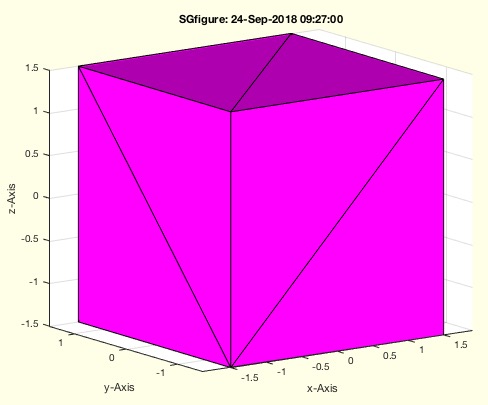 |
fontsize4rowsfullHD | font size for lectures and video recording on 25 lines |  |
FSplot | plots the featureEdges of TR, SG or VLFL | 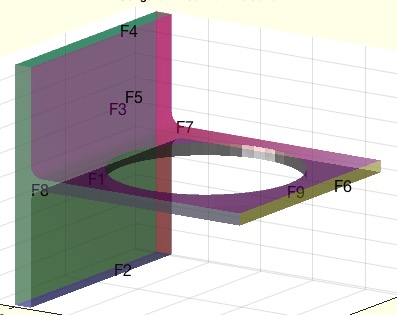 |
gcahandleofSG | returns the handle to all patches of gca | 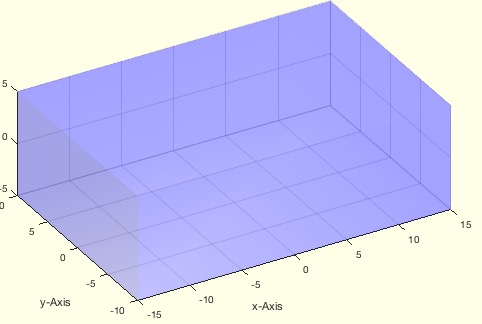 |
gcasnapshot | saves the current figure as JPG-File on the user desktop |  |
gccp | returns cameraposition, cameradirection and cameratarget |  |
gcfSG | in contrast to gcf, this fnct returns empty if there is no open window |  |
getframeaxis | same as frameaxis but also stores the axis information |  |
im2stereo | returns corresponding points within 2 images taken from different view points | 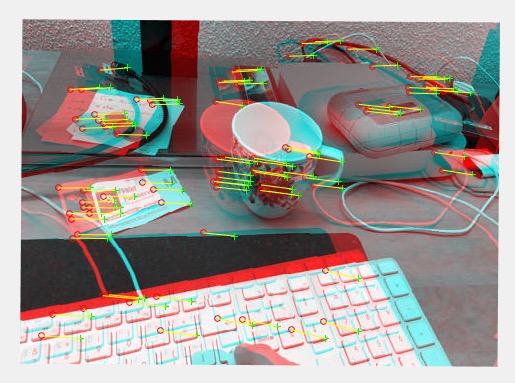 |
imageofgca | returns the image snapshot of the currect gca | 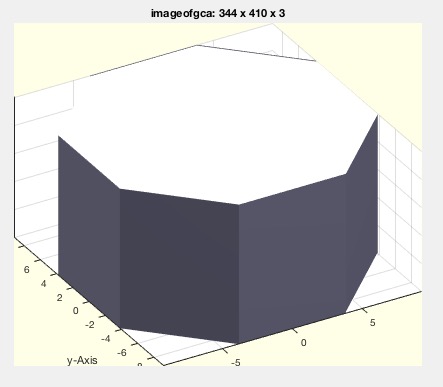 |
imageVideoTextPage | creates a textpage image for a video | 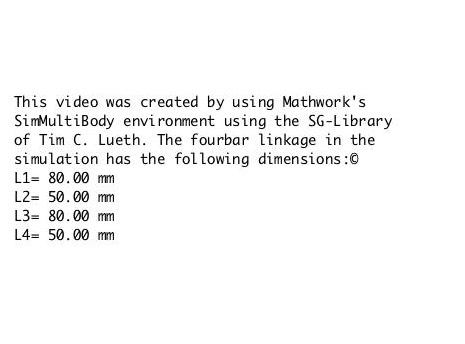 |
implot | plots an image as scaled texture | 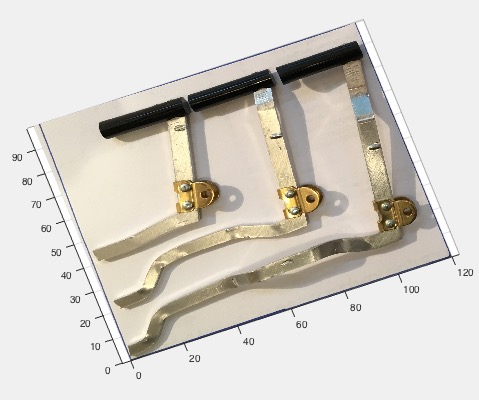 |
isSGfigureStop | will be called during animations |  |
lplot | plots a straight line between 2 points | 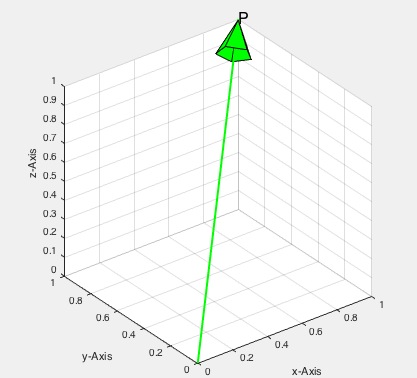 |
lplots | plots a straight lines between 2 point lists | 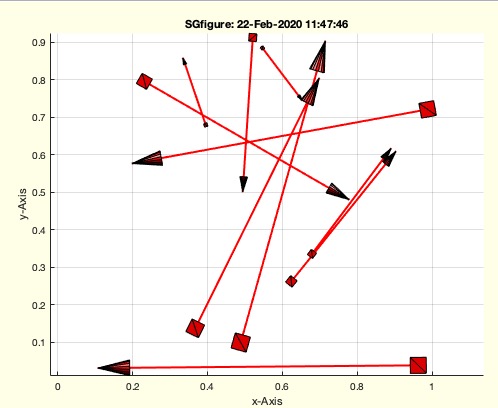 |
patchupdateSG | replaces an existing patch handle by updated SG |  |
plotannotationSG | plots a solid into the upper right corner of the current graphics axis | 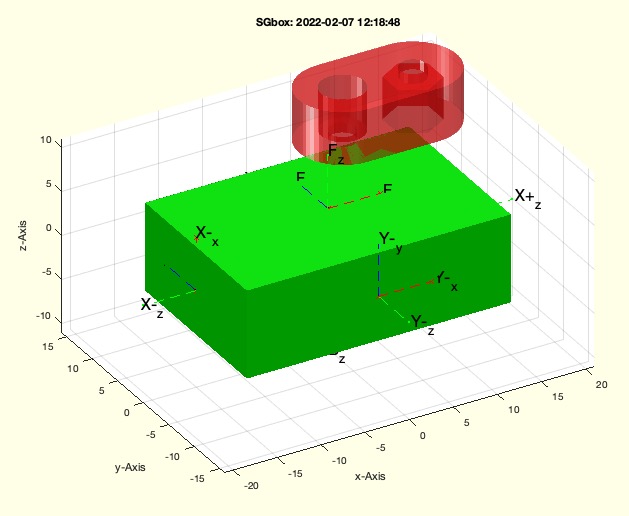 |
plotCVL | plots facet that is enclosed by the vertex contour list |  |
plotL | plots a HT-matrix as straight line | 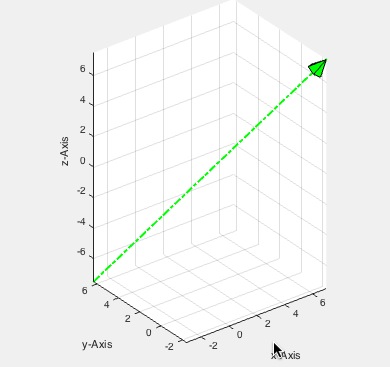 |
plotruler4SG | creates dimensions on the outside of a geometric body | 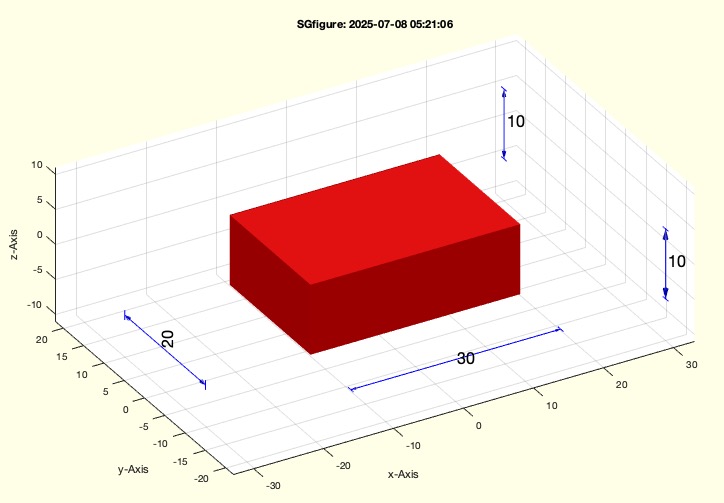 |
plotrulerline | draws an simple ruler between two points in 2D |  |
plotT2P | plots a HT matrix as straight line vector | 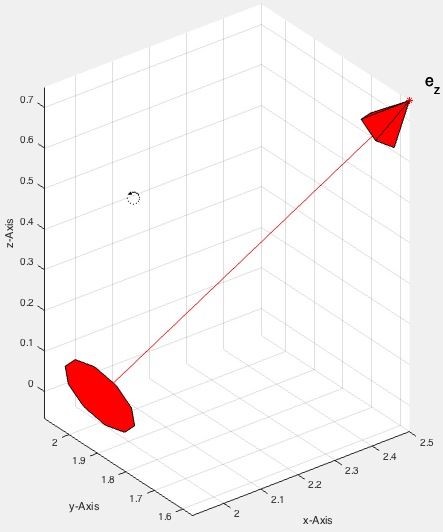 |
plotTP | plots the basic planes of a coordinate system | 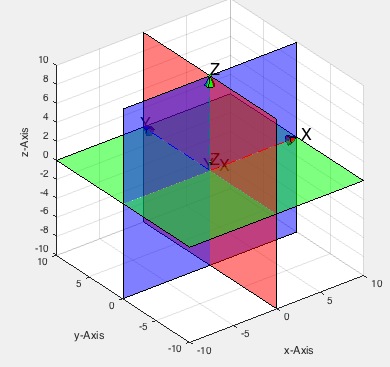 |
PLplot | plots a 2D polygon in a 3D figure |  |
PLplotcorrelation | simply plots a point list correlation | 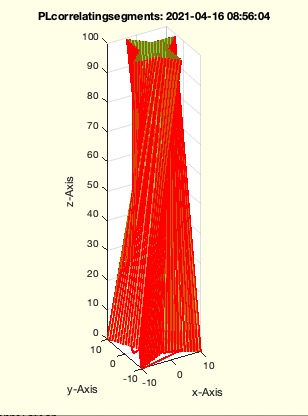 |
popgcf | remains only the remembered graphics object in the current figure | 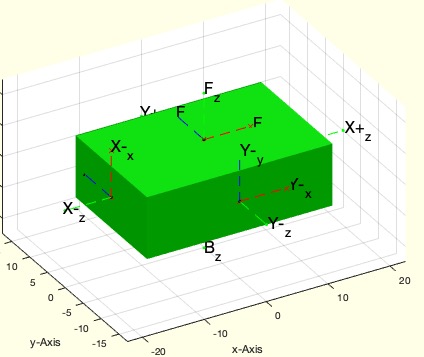 |
pplot | pplot shows a 3D-plot figure of a point or a list of points |  |
PSplot | plots a polyshape but also a cell list of polyshapes | 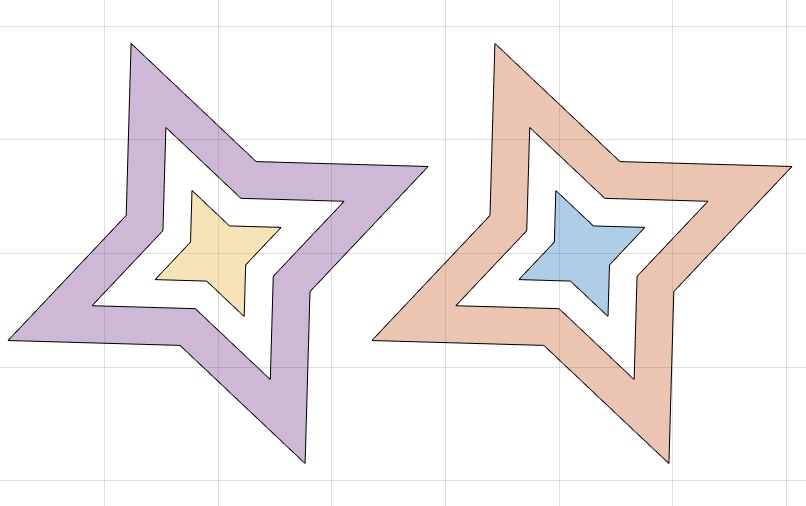 |
pushgcf | remembers all graphics object in the current figure; | 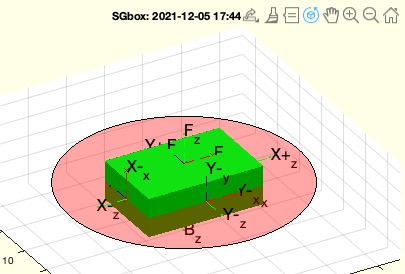 |
rgb2bgr16 | converts a RGB 3 x 8 Bit color into a BGR 3 x 5 + 1 Bit = 16 Bit Value for STL attribute by color values | 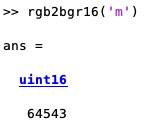 |
rgb2char | returns a color character from an RGB value | 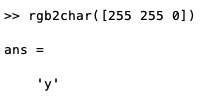 |
rgbofall | return all different methods of matlab into a rgb set as type double | 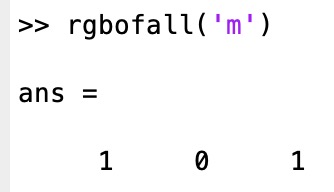 |
rotate3dlight | Switches the automatic camera light conditions on and off | 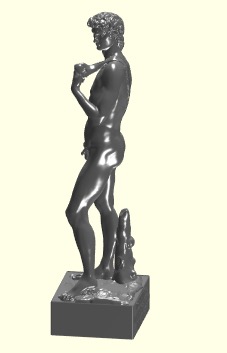 |
rulerCPL | plots ruler for a closed polygon list | 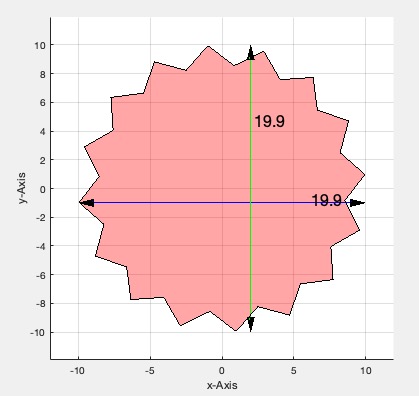 |
rview | Restores parameters of the current figure/View |  |
select3d | Determines the selected point in 3-D data space. | 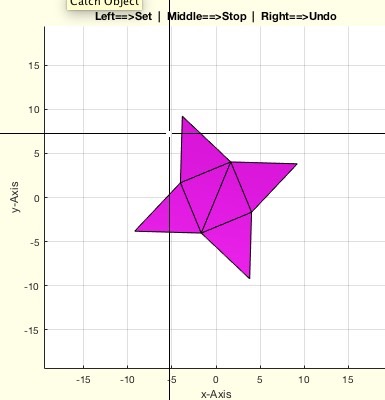 |
select3dofcam | creates all selectin information for the | 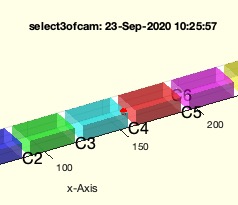 |
setcamangle | set the camera angle is set |  |
setcamdirection | sets the camera position without changing the camera target | 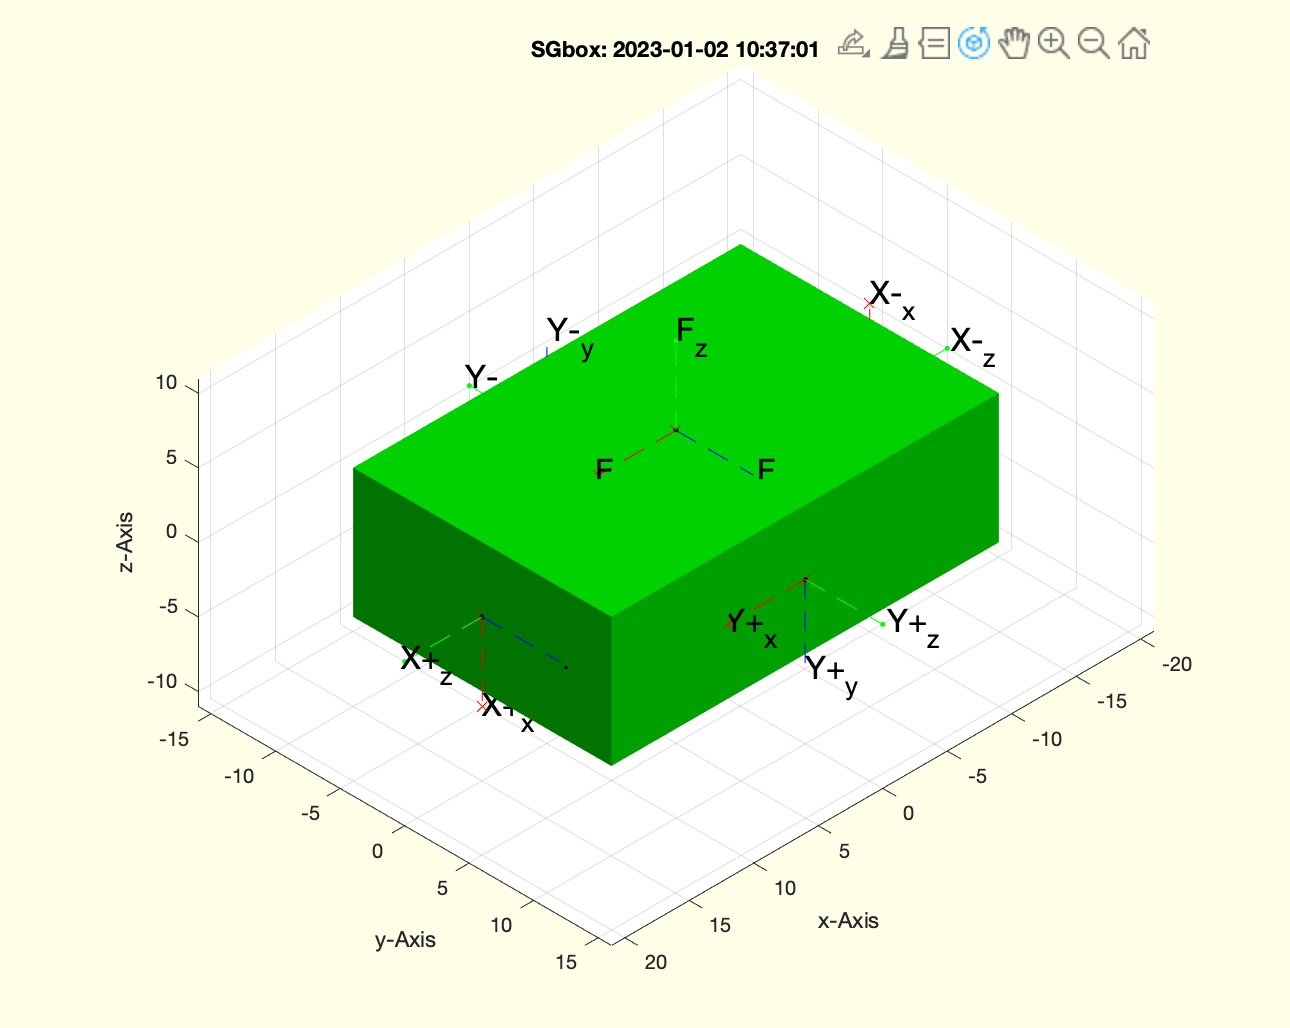 |
setcamdistance | The distance of the camera position relative to the target position is fixed | 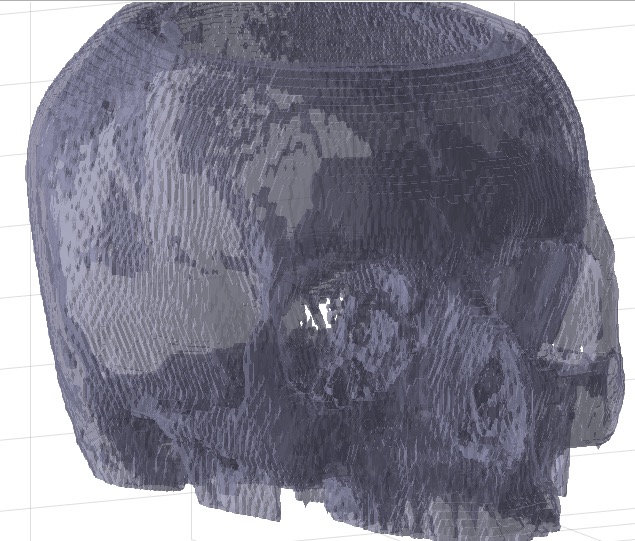 |
setcamtarget | set the camera target interactively by a mouse click or a point or a frame | 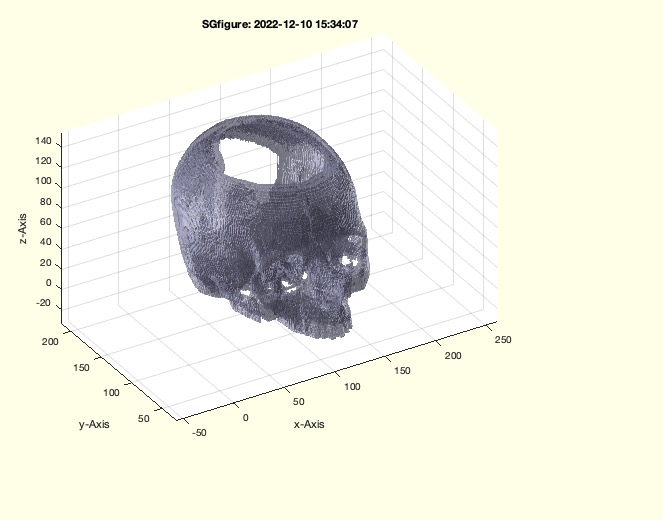 |
setcamzoom | zoom by changing the camera view angle; |  |
setplotlight | changes the alpha value of a given graphics object handle | 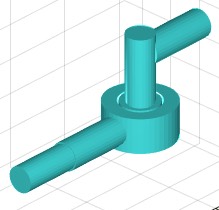 |
SGanimateSLLL | Animates a set of solids using the SLLL format | 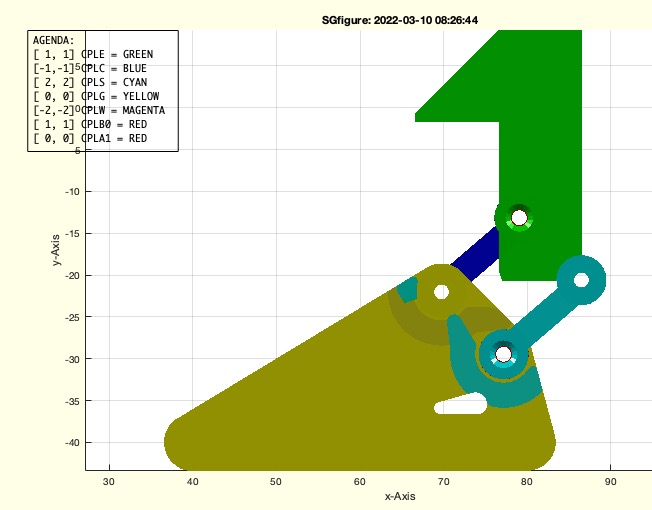 |
SGarrow | returns a SG for an arrow | 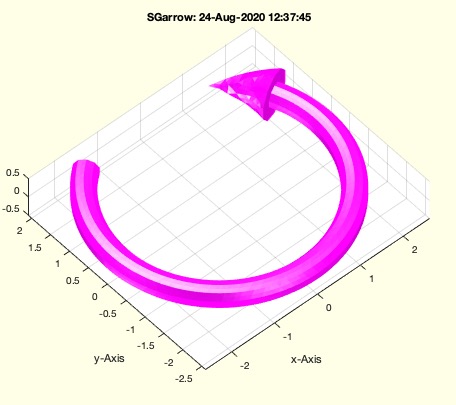 |
SGcastplot | creates plots in a cell list wrt to the SGcast type | 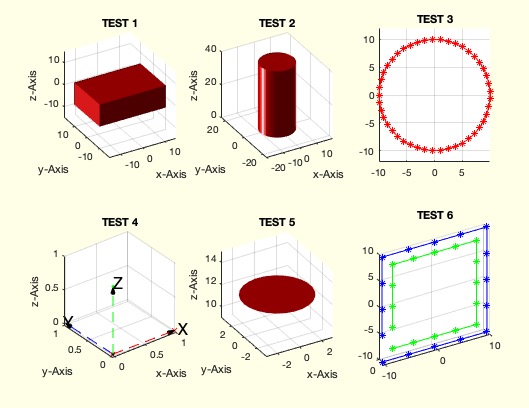 |
SGcolorerrors | idea simply to color solids instead of showing the errors | 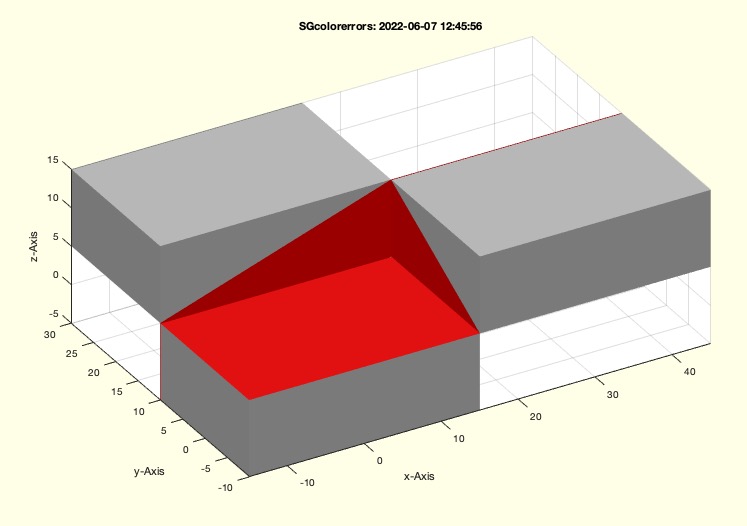 |
SGfigure | Application for opening and viewing STL Files | 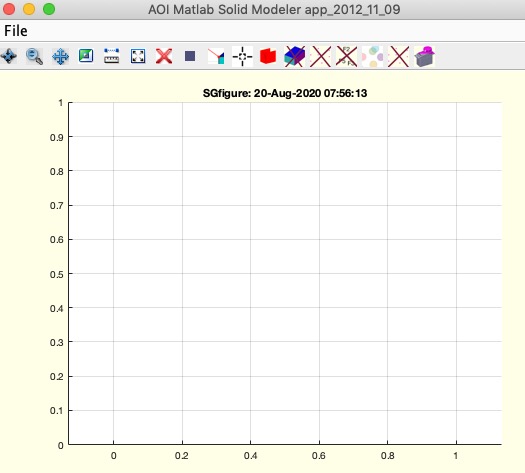 |
SGfigurefooter | plots a footer into the window |  |
SGimaging | creates a simulated transparent surface view or slice view | 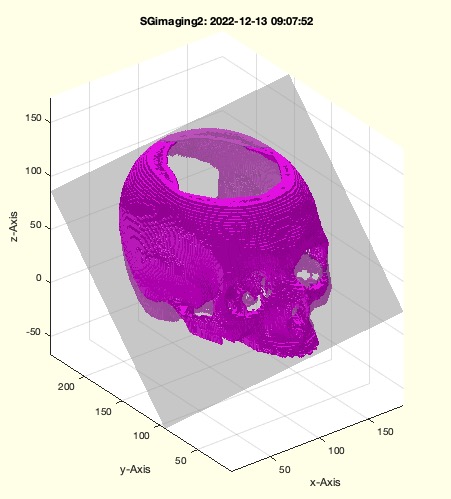 |
SGofgca2subplots | takes the current gca and creates a cell list of solids/patches | 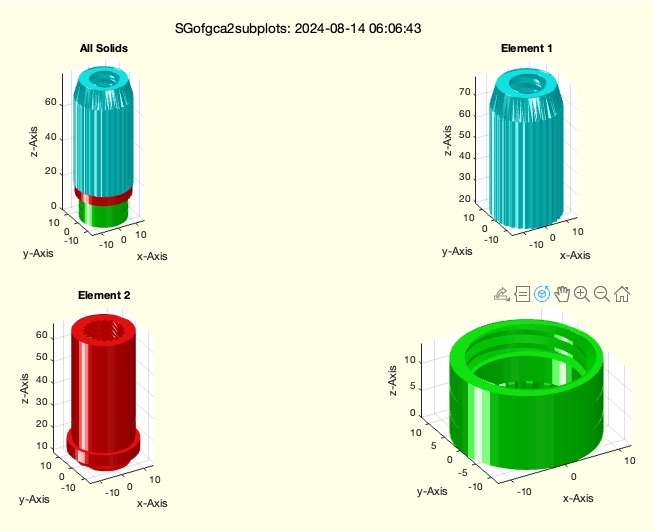 |
SGofgcfsubplots | takes the current gcf, collects all patches in the subplots and creates a cell list of solids/patches | 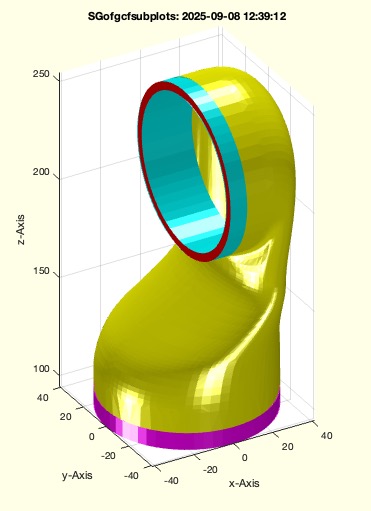 |
SGofT | generates an infinitely small cube (1e-17) at T | 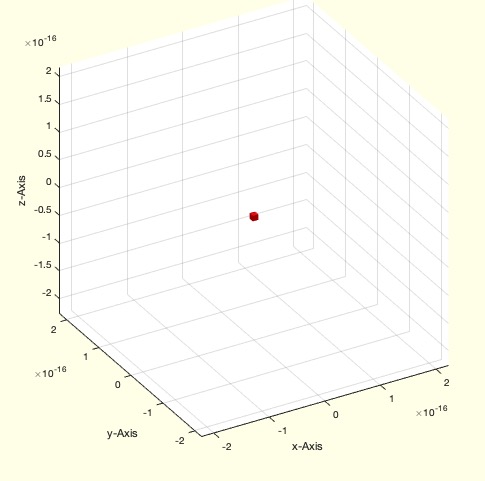 |
SGplot | plots a solid geometry | 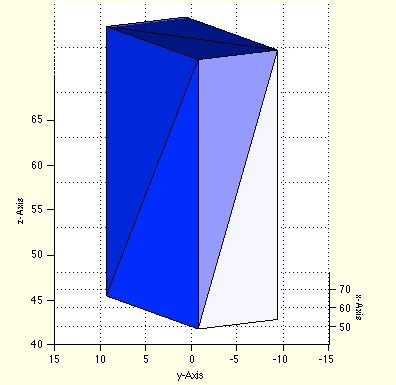 |
SGplot4 | plots a solid in 4 views | 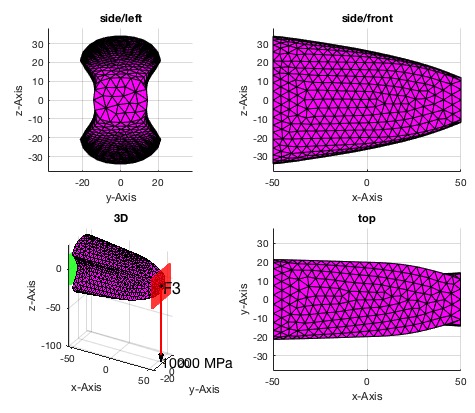 |
SGplotcellmultiple | Creates a SGfigure and plots all cell elements in different subplots | 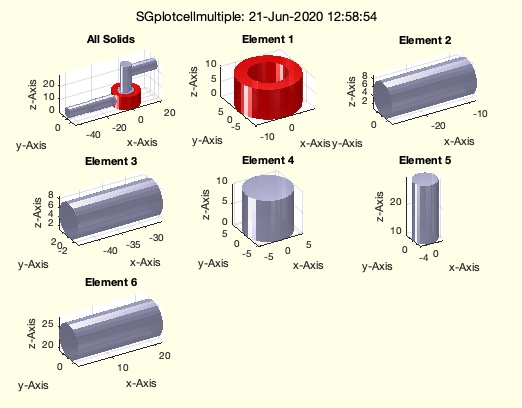 |
SGplotgears | plot a gear i predefined colors from blue(1st) to orange (last) | 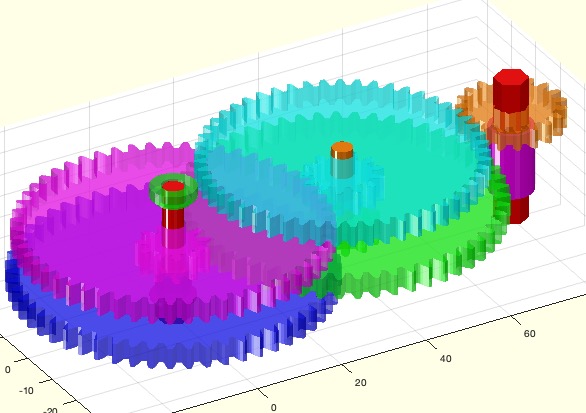 |
SGplotmultiple | creates a figure and simply plots all solids in a cell aray | 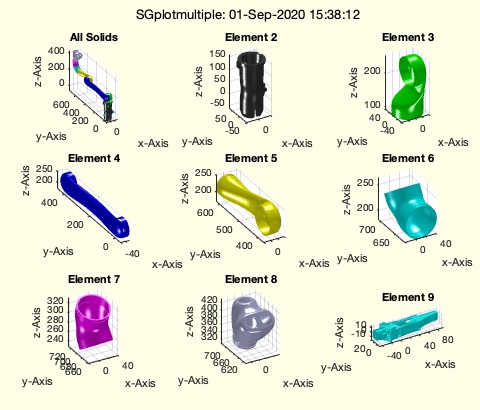 |
SGshowcolors | shows different colors to understand how to set rgb values | 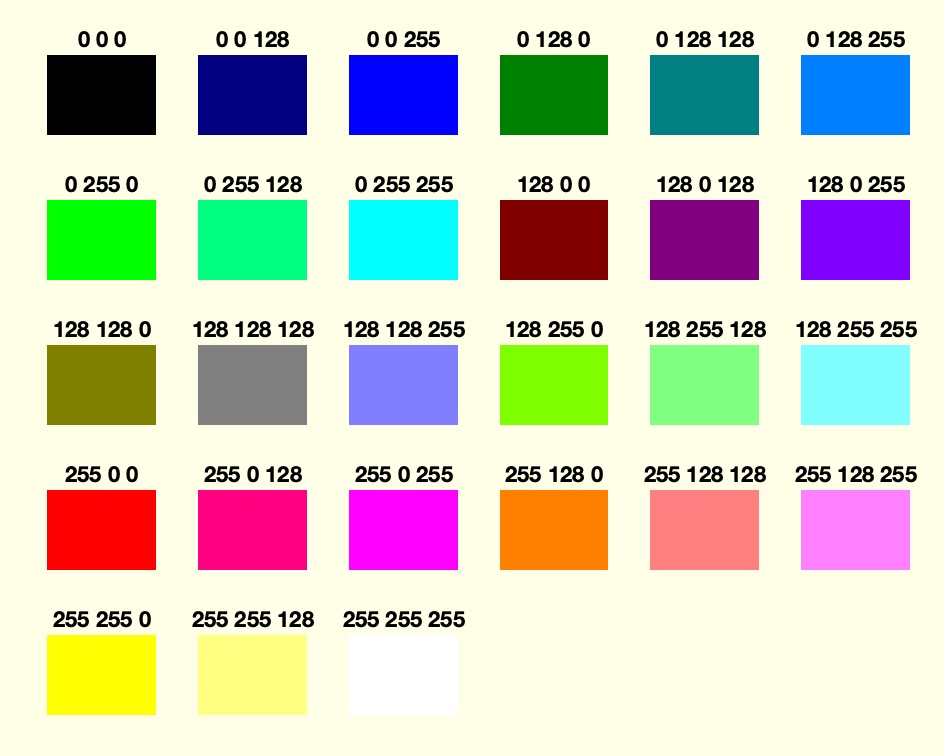 |
showrf | returns or shows only the reverse facets from the current view point |  |
slplot | straight line plot | 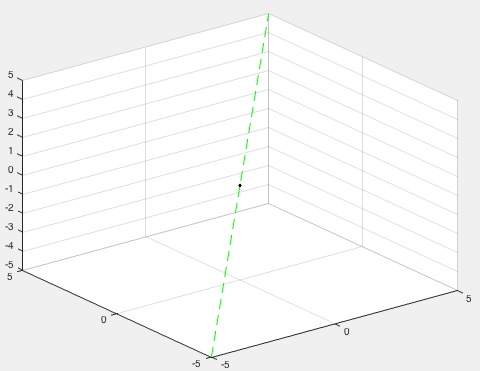 |
snapplot | saves the current figure as JPG-File on the user desktop | 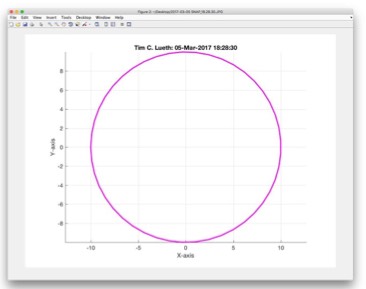 |
subfig | creates subfigures on the screen similar to subplot | 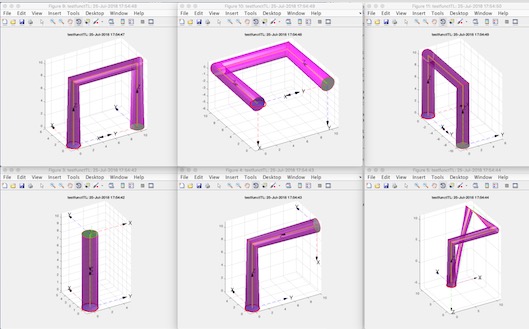 |
subplotnumber | simply returns the number of subplots | 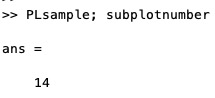 |
surfofgca | returns the surfaces (not the patches) from the graphics handel | 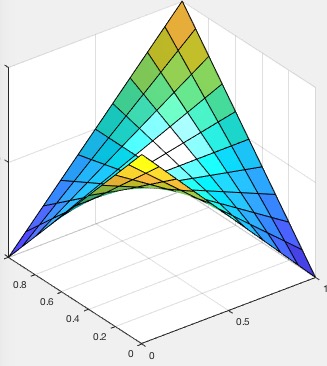 |
sview | Stores parameters of the current figure/View |  |
tcamera | set camera to look on a given HT matrix using current zoom |  |
textCPL | plots descriptors for each contour into a figure using text command |  |
textCPS | writes text descriptors to CLPS | 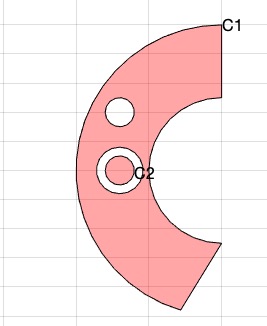 |
textCVL | plots descriptors for each contour into a figure using text command | 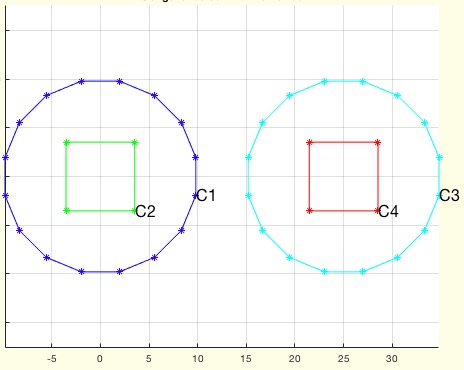 |
textVL | plots descriptors for each vertex in the figure using the text command | 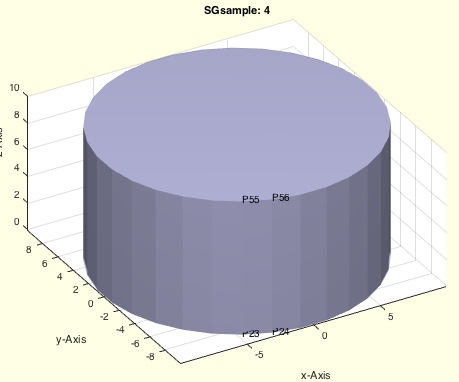 |
textVLFL | plots descriptors for each facet in the figure using the text command | 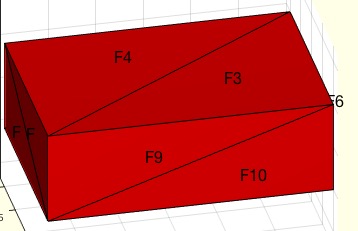 |
textVLFS | plots descriptors for each feature surface and the corresponding feature edges | 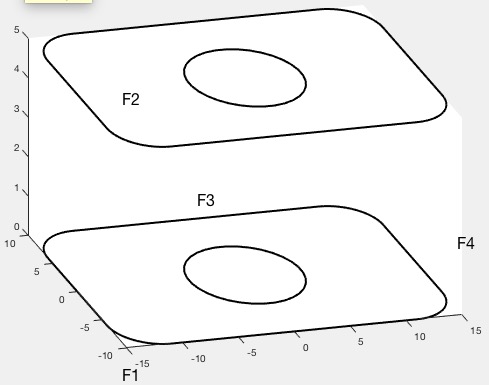 |
titleprintftext | creates a title based on the parameterlist given by the calling fnct |  |
tlplot | plots a line given as HT matrix using t+k*ez | 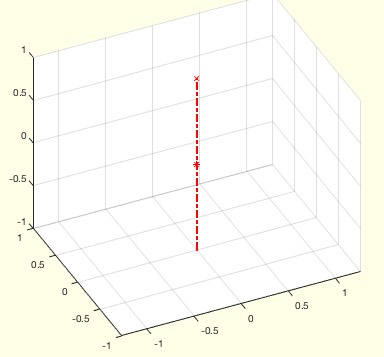 |
togglefig | toggels the position of the current SGfigure | 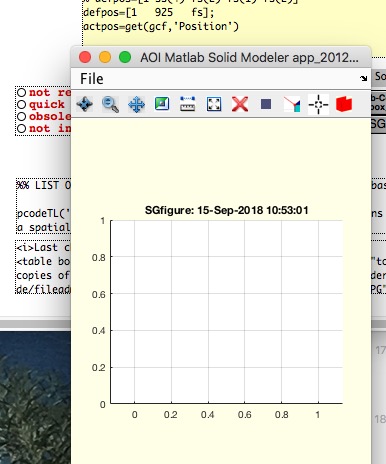 |
toggleviewprojection | toggle view projection between "orthographic" and "perspective" | 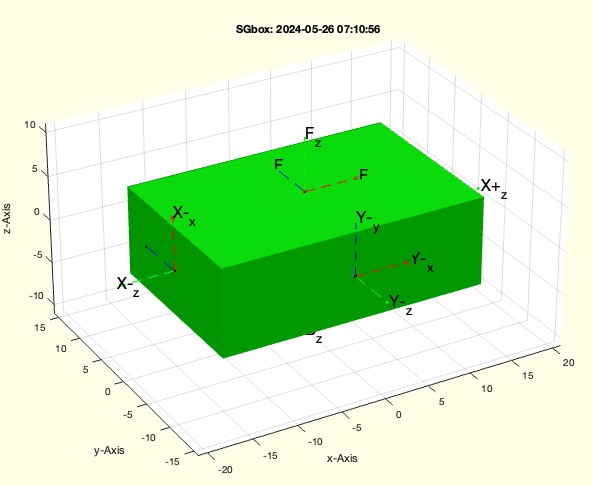 |
tplotaxis | plots the elongation of the z-axhis of a frame or a frame list | 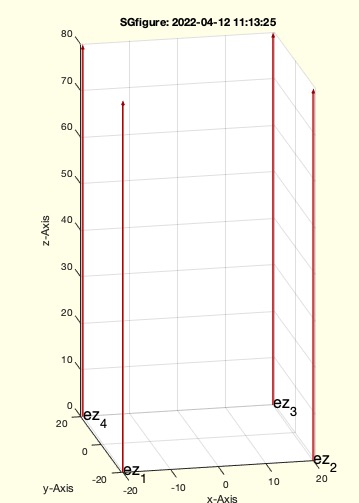 |
tplotruler | plots a 3D ruler als arrow sequence in a figure |  |
uitogglefigstyle | Application callback procedure for toggeling grid an colors |  |
updategco | updates an graphics object with new coordiantes |  |
video2animatedGIF | creates an animated GIF from a video file |  |
video2video | creates an AVI in different size and speed from a video file |  |
view4all | sets the view angles for all subplots the same | 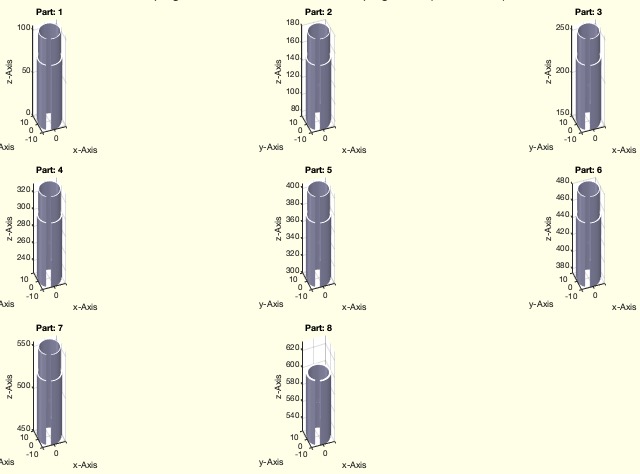 |
viewsmooth | slowly rotates to a new viwe | 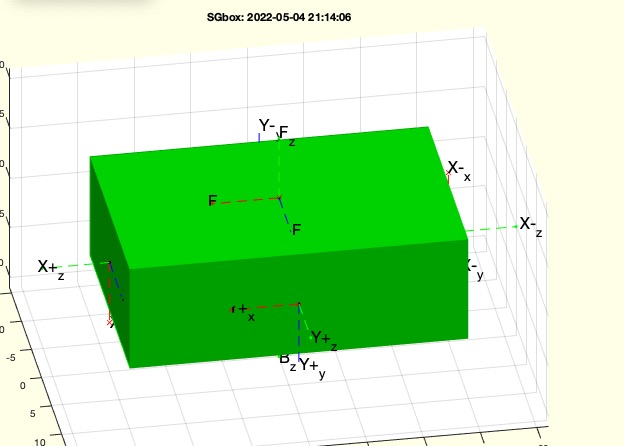 |
VLcol | generates a simple colormap related to the basic Matlab colors |  |
VLELCILplots | plots contours given as vertex list and edge list |  |
VLELplot | plots lines given as vertex list CVL and edge list CLL | 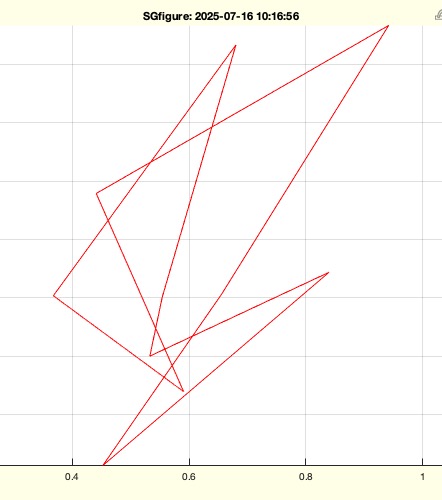 |
VLELplots | plots lines given as vertex list and edge list | 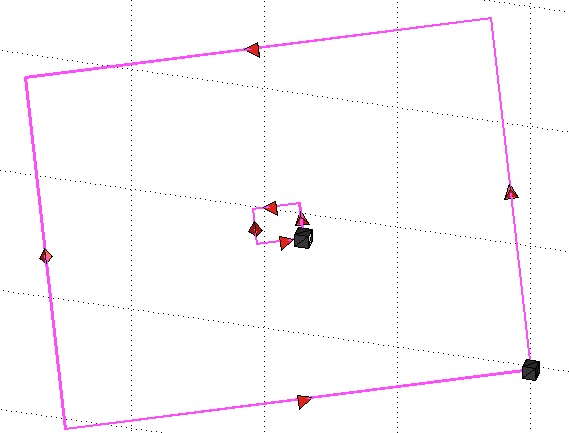 |
VLFLcamlight | set the current light source on the position of the viewpoint |  |
VLFLELplot | plots an edge list and all attached facets of the edges |  |
VLFLfaceNormalplot | plots normal vector in appropriate length and writes the name of the facet at the tip | 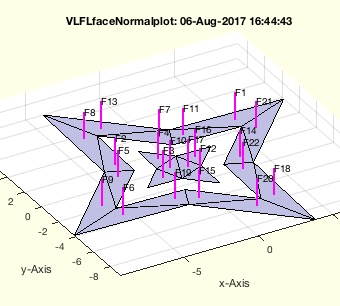 |
VLFLfigure | Application for opening and viewing STL Files | 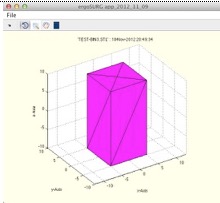 |
VLFLofgca | returns the vertex list and facet list of the current figure | 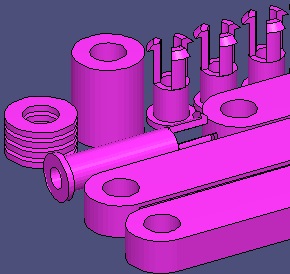 |
VLFLofPatch | returns vertex list and facet list of current figure or the current object |  |
VLFLplot | plots a vertexlist and facet list by fill3 in a figure | 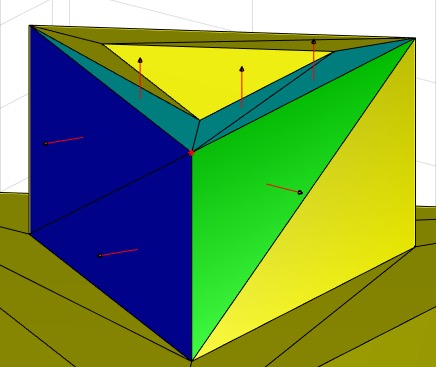 |
VLFLplot | plots a surface geometry |  |
VLFLplot4 | plots a vertex/facet list by fill3 in a figure with 4 Subplots | 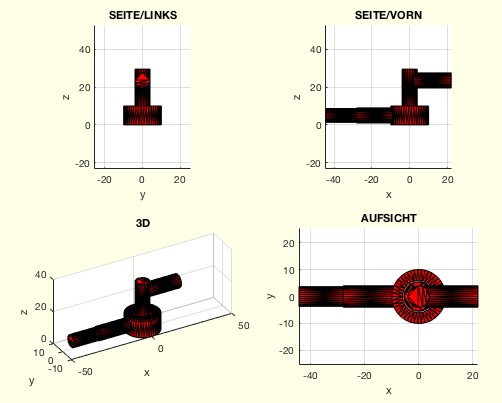 |
VLFLplotfi | plots the scenery around some vertices in unequal scale | 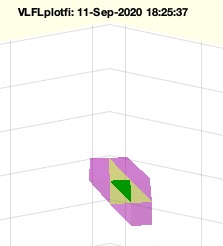 |
VLFLplotlight | switches the light and renderer on for VLFLplots and VLFLplots4 | 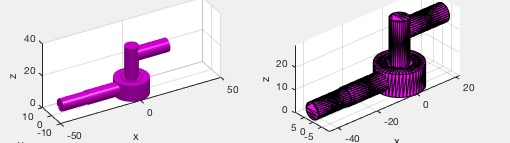 |
VLFLplotlightoff | switches the camlights on or off | 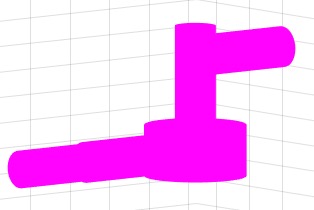 |
VLFLplotmanifold | plots a the non manifold points, edges, and facets of a solid | 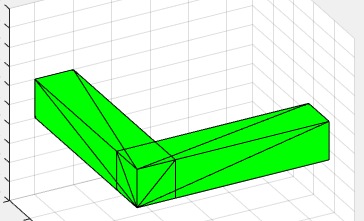 |
VLFLplots | plots an object/solid as shaded or faceted object | 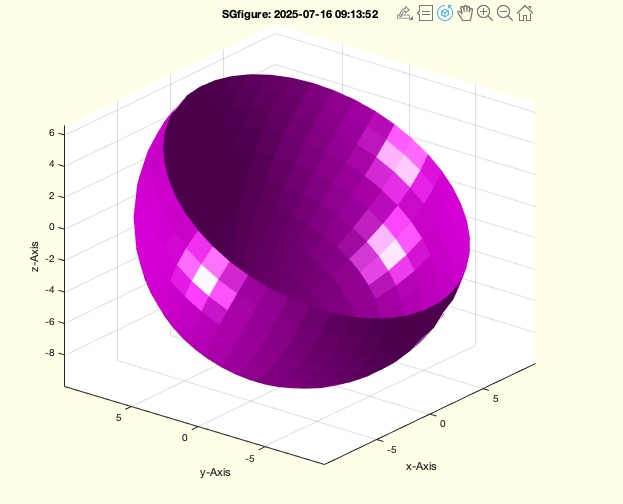 |
VLFLplots4 | plots an object/solid as shaded or faceted object in 4 views | 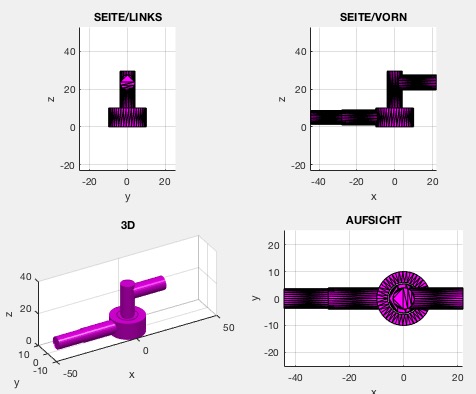 |
VLFLshow | simply brings the current figure in the front |  |
VLofgca | returns all vertices of the current figure patches |  |
VLofgcalines | creates a list of vertex points used in | 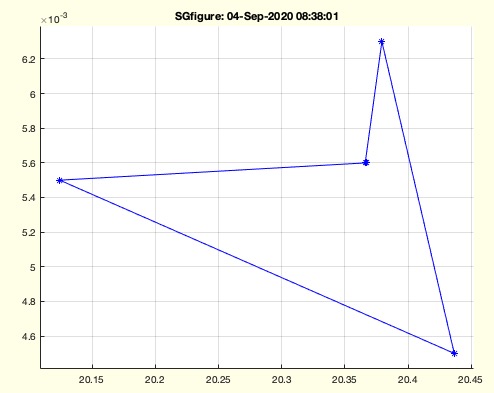 |
VLOLplot | prints one or all surfaces of an object list |  |
VLplot | Plots different views of a vertex list (nx3) as contour lines or individual points. | 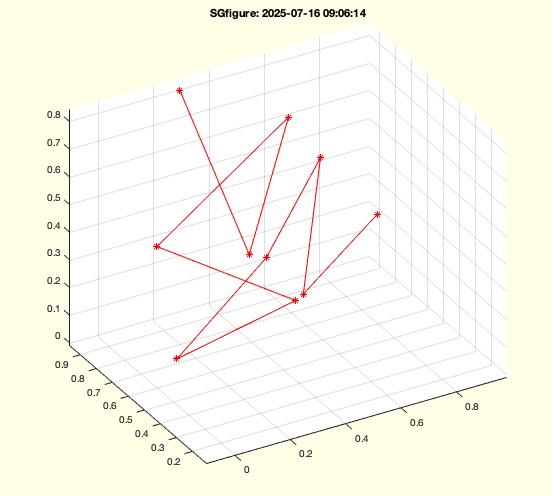 |
VLplotdelaunay | simple inspection fnct | 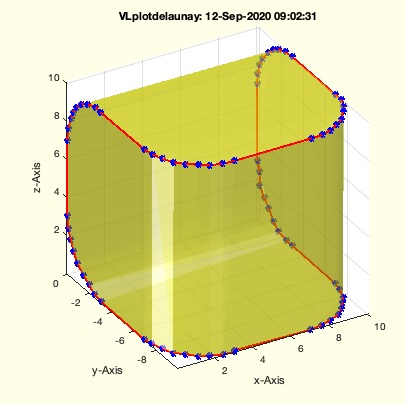 |
VLULplot | Plots the union list of an object, union face by union face |  |
VMimage | returns three crosssectional views of an image stack (voxel model) | 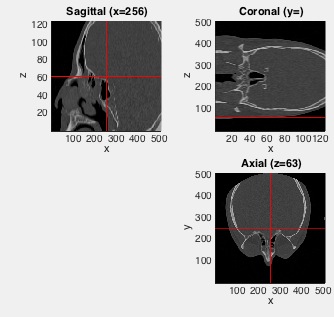 |
VMplot | plots a 3D volumetric matrix in 2x2 view | 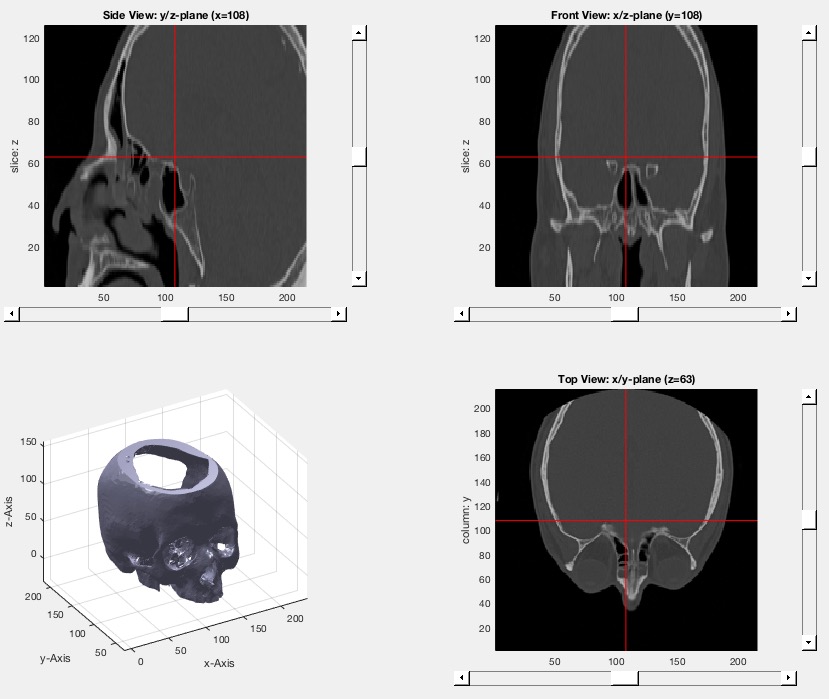 |
zoompatch | zooms to see all patches of the current figure axis | 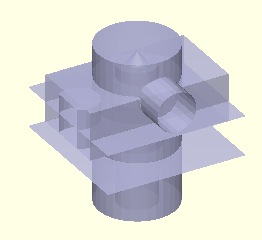 |
zoomsubplot | opens a figure and zooms the subplot image |  |