cplot
by Tim C. Lueth, SG-Lib Toolbox: SolidGeometry 5.6 - Visualization
Introduced first in SolidGeometry 5.1, Creation date: 2021-12-14, Last change: 2025-09-15
Plots a list of circle segments
Description
dw=wins(:,2)-wins(:,1); s1=angleshift(wins(:,1)); wins=[s1 s1+angleshift(dw)];
See Also: isincirclesegment
, CPLcrosscircseg
, angleshift
, angleinterv
, circlesegmentofPL
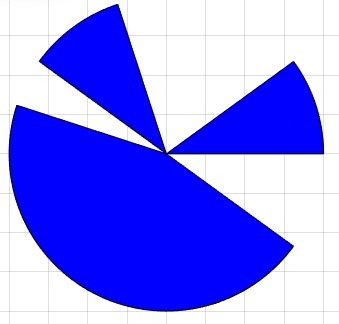
Example Illustration
Syntax
h=cplot([A0,wins,fc,fa,ec,lw])
Input Parameter
A0: | | Center and Radius of circle [x y R]; default is [0 0 1] |
wins: | | [min max]; angle |
fc: | | optional FaceColor |
fa: | | optional FaceAlpha |
ec: | | optional EdgeColor |
lw: | | optional Edge Line Width |
Output Parameter
Examples
SGfigure; cplot ([10 10 2],[0 0.2*pi; 0.6*pi 0.8*pi; 0.9*pi 1.8*pi]+2*pi,'b',1)
Copyright 2021-2025 Tim C. Lueth. All rights reserved. The code is the property of Tim C. Lueth and may not be redistributed or modified without explicit written permission. This software may be used free of charge for academic research and teaching purposes only. Commercial use, redistribution, modification, or reverse engineering is strictly prohibited. Access to source code is restricted and granted only under specific agreements. For licensing inquiries or commercial use, please contact: Tim C. Lueth
Algorithm (Workflow)
Algorithm explaination created using ChatGPT on 2025-08-19 07:50. (Please note: No guarantee for the correctness of this explanation)
Last html export of this page out of FM database by TL: 2025-09-21