by Tim C. Lueth, SG-Lib Toolbox: SolidGeometry 5.6 - Visualization
Introduced first in SolidGeometry 4.3, Creation date: 2018-09-25, Last change: 2025-09-14
See Also: aplot
, pplot
, lplot
, tfplot
, tlplot
, slplot
, plotTP
, plotL
, plotT
, textP
, textT
h=bplot(VL,bs,[])
VL: | Vertex list | |
bs: | Box size |
h: | handle to graphics object |
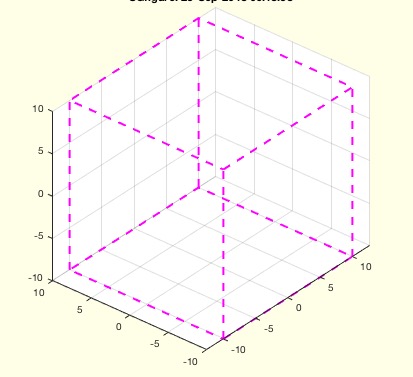
SGfigure; h=bplot([0 0 0],20,'m--',2); view(-30,30); pause(1); delete(h)
VL=rand(10,3)*100; h=bplot(VL,20,'m--',2); view(-30,30);The function bplot is designed to plot grid boxes at specified positions using a vertex list and box size. It is part of the SolidGeometry library and is used for visualization purposes.
h to store handles to the graphics objects.bs is a scalar. If so, convert it to a 3-element vector [bs bs bs].PL representing the base of the box using the dimensions of bs.VL:bs(3)/2) to the z-coordinate of the plane PL.VLplot and store the handles in h.lplot and store the handles in h.The function can be used to plot a single box or multiple boxes at specified positions. For example:
SGfigure; h=bplot([0 0 0],20,'m--',2); view(-30,30); pause(1); delete(h)
VL=rand(10,3)*100; h=bplot(VL,20,'m--',2); view(-30,30);
In this example, a box is plotted at the origin with a size of 20 mm and a magenta dashed line style. The view is adjusted, and the box is deleted after a pause. Multiple boxes are plotted at random positions in the second example.
Algorithm explaination created using ChatGPT on 2025-08-19 01:15. (Please note: No guarantee for the correctness of this explanation)