lplot
by Tim C. Lueth, SG-Lib Toolbox: SolidGeometry 5.6 - Visualization
Introduced first in SolidGeometry 1.0, Creation date: 2010-07-01, Last change: 2025-09-14
plots a straight line between 2 points
Description
plots a straight line between 2
USE lplots for list of points
See Also: lplots
, pplot
, tfplot
, aplot
, tlplot
, slplot
, plotTP
, plotL
, plotT
Example Illustration
Syntax
[hh,pt]=lplot(p1,p2,[c,w,ts,ss,str,fs])
Input Parameter
p1: | | Starting point |
p2: | | End point |
c: | | Color and symbol default is "r*-" |
w: | | line width; default is 1 |
ts: | | tip size; 0==auto |
ss: | | start block size; 0==auto |
str: | | Text string at tip |
fs: | | font size of text |
Output Parameter
hh: | | handle to all line elements |
pt: | | point between p1 and p2 for text |
Examples
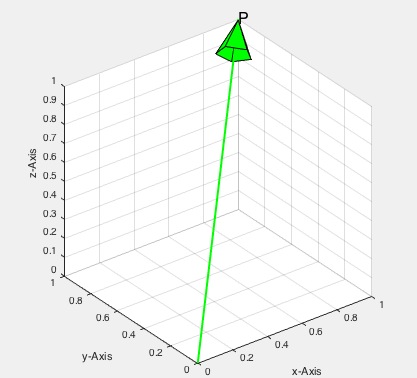
draws a green line with an arrow at the tip and a text 'P'
lplot ([0 ;0; 0],[1; 1; 1],'g',2,0,-1,'P',16);
Copyright 2010-2025 Tim C. Lueth. All rights reserved. The code is the property of Tim C. Lueth and may not be redistributed or modified without explicit written permission. This software may be used free of charge for academic research and teaching purposes only. Commercial use, redistribution, modification, or reverse engineering is strictly prohibited. Access to source code is restricted and granted only under specific agreements. For licensing inquiries or commercial use, please contact: Tim C. Lueth
Last html export of this page out of FM database by TL: 2025-09-21