aplot

by Tim C. Lueth, SG-Lib Toolbox: SolidGeometry 5.6 - Analytical Geometry
Introduced first in SolidGeometry 3.4, Creation date: 2017-02-07, Last change: 2025-09-14

draws an angle relative to a center and two vectors


See Also: aplot , pplot , lplot , tfplot , tlplot , slplot , plotTP , plotL , plotT , textP , textT

Example Illustration

 missing image of aplot(pc,la,lb,c,w,r,alpha)

Syntax

[h,pt,a]=aplot(pc,la,[lb,c,w,r,alpha])

Input Parameter

pc: center of angle
la: 1st vector
lb: 2nd vector or angle or rotation matrix
c: color; default is 'r'
w: width of lines; default is 1;
r: radius; default is
alpha: transparency

Output Parameter

h: handle to all elements of the angle drawing
pt: point for text desciption
a: angle that was used if lb was a vector

Examples


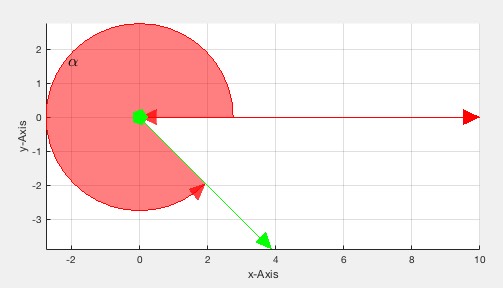
[h,pt]=aplot ([0 0],[10 0],3.5*pi/2)
textP(pt,'alpha');


Copyright 2017-2025 Tim C. Lueth. All rights reserved. The code is the property of Tim C. Lueth and may not be redistributed or modified without explicit written permission. This software may be used free of charge for academic research and teaching purposes only. Commercial use, redistribution, modification, or reverse engineering is strictly prohibited. Access to source code is restricted and granted only under specific agreements. For licensing inquiries or commercial use, please contact: Tim C. Lueth

Last html export of this page out of FM database by TL: 2025-09-21