plotTP
by Tim C. Lueth, SG-Lib Toolbox: SolidGeometry 5.6 - Visualization
Introduced first in SolidGeometry 1.0, Creation date: 2010-08-09, Last change: 2025-09-14
plots the basic planes of a coordinate system
Description
' ' returns blind planes
'' returns a default color
See Also: pplot
, lplot
, tfplot
, tlplot
, slplot
, plotL
, plotT
Example Illustration
Syntax
plotTP(T,[f,a,c1,c2,c3])
Input Parameter
T: | | HT matrix for coordinate system |
f: | | size of the plane |
a: | | transparency value |
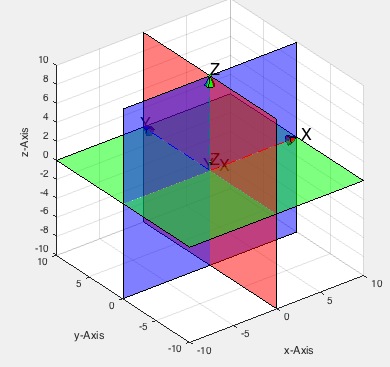
c1: | | color of plane x==0 ; default is 'r' |
c2: | | color of plane y==0 ; default is 'b' |
c3: | | color of plane z==0 ; default is 'g' |
Examples
plot three planes of size 10
plotTP(eye(4),10);
Copyright 2010-2025 Tim C. Lueth. All rights reserved. The code is the property of Tim C. Lueth and may not be redistributed or modified without explicit written permission. This software may be used free of charge for academic research and teaching purposes only. Commercial use, redistribution, modification, or reverse engineering is strictly prohibited. Access to source code is restricted and granted only under specific agreements. For licensing inquiries or commercial use, please contact: Tim C. Lueth
Last html export of this page out of FM database by TL: 2025-09-21