plotT
by Tim C. Lueth, SG-Lib Toolbox: SolidGeometry 5.6 - Analytical Geometry
Introduced first in SolidGeometry 1.0, Creation date: 2010-06-01, Last change: 2025-09-14
plots a coordinate system given as HT matrix
Description
Does support 2D (3x3) and 3D (4x4) HT matrices
See Also: pplot
, lplot
, tfplot
, tlplot
, slplot
, plotTP
, plotL
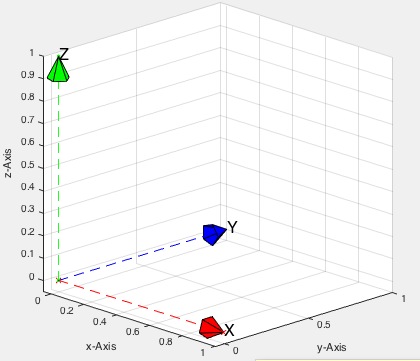
Example Illustration
Syntax
h=plotT(T,[s,w,N,ts])
Input Parameter
T: | | HT matrix of the coordinate system |
s: | | size of the unit vectors, default is 1 |
w: | | width of the matlab lines, default is 1 |
N: | | Name of coordinate system |
ts: | | if empty, no surfaces for tips and origin |
Output Parameter
Examples
Plots the Origin
plotT(eye(4),1,2,'A');
Copyright 2010-2025 Tim C. Lueth. All rights reserved. The code is the property of Tim C. Lueth and may not be redistributed or modified without explicit written permission. This software may be used free of charge for academic research and teaching purposes only. Commercial use, redistribution, modification, or reverse engineering is strictly prohibited. Access to source code is restricted and granted only under specific agreements. For licensing inquiries or commercial use, please contact: Tim C. Lueth
Algorithm (Workflow)
This function, plotT, is designed to plot a coordinate system using a homogeneous transformation (HT) matrix. It supports both 2D (3x3) and 3D (4x4) HT matrices.
Input Parameters
- T: The HT matrix representing the coordinate system. It can be either 3x3 for 2D or 4x4 for 3D.
- s: The size of the unit vectors. The default value is 1.
- w: The width of the MATLAB lines. The default value is 1.
- N: The name of the coordinate system. If not provided, default axis labels 'X', 'Y', and 'Z' are used.
- ts: If empty, no surfaces for tips and origin are plotted.
Output
- h: Handles to the plotted lines and points.
Algorithm Steps
- Determine the dimension
d of the HT matrix. If T is 3x3, convert it to a 4x4 matrix using T3ofT2 and set d to 2.
- Extract the translation vector
t and the unit vectors ex, ey, and ez from the HT matrix.
- Set default values for
s, w, and N if they are not provided in varargin.
- Determine axis labels
xt, yt, and zt based on the presence of N.
- Plot the x-axis using
lplot from t to t+s*ex with a red dashed line.
- Plot the y-axis using
lplot from t to t+s*ey with a blue dashed line.
- Plot the z-axis using
lplot from t to t+s*ez with a green dashed line if d is 3; otherwise, plot a shorter line.
- Plot the origin point
t using pplot with a black dot.
- Return the handles
h of the plotted elements.
Algorithm explaination created using ChatGPT on 2025-08-19 07:58. (Please note: No guarantee for the correctness of this explanation)
Last html export of this page out of FM database by TL: 2025-09-21