tlplot
by Tim C. Lueth, SG-Lib Toolbox: SolidGeometry 5.6 - Visualization
Introduced first in SolidGeometry 1.0, Creation date: 2010-09-04, Last change: 2025-09-14
plots a line given as HT matrix using t+k*ez
See Also: pplot
, lplot
, tfplot
, slplot
, plotTP
, plotL
, plotT
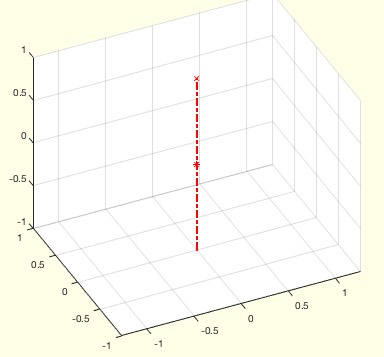
Example Illustration
Syntax
tlplot(T,[c,l])
Input Parameter
T: | | Transformation matrix |
c: | | color |
l: | | length of line |
Copyright 2010-2025 Tim C. Lueth. All rights reserved. The code is the property of Tim C. Lueth and may not be redistributed or modified without explicit written permission. This software may be used free of charge for academic research and teaching purposes only. Commercial use, redistribution, modification, or reverse engineering is strictly prohibited. Access to source code is restricted and granted only under specific agreements. For licensing inquiries or commercial use, please contact: Tim C. Lueth
Algorithm (Workflow)
The function tlplot is designed to plot a line in 3D space using a transformation matrix. It is part of the SolidGeometry library and is used for visualization purposes.
Input Parameters
- T: A 4x4 transformation matrix that defines the position and orientation of the line in 3D space.
- c: (Optional) A string representing the color of the line. Default is 'c' (cyan).
- l: (Optional) A scalar representing the length of the line. Default is 1.
Algorithm Steps
- The function begins by ensuring that the current plot is held, allowing multiple plots to be drawn on the same figure without erasing previous plots.
- It checks the number of input arguments to determine if the color and length parameters have been provided. If not, it assigns default values ('c' for color and 1 for length).
- The function calculates the start and end points of the line using the transformation matrix
T and the length l. The start point is T(1:3,4) - l*T(1:3,3) and the end point is T(1:3,4) + l*T(1:3,3).
- It calls the
lplot function to draw the line between the calculated start and end points. The line style is specified as a dotted line with the color c.
- The function uses
pplot to plot the origin point of the line (the position defined by T(1:3,4)) with a marker style of * in color c.
- Finally, it plots the end point of the line using
pplot with a marker style of x in color c.
Algorithm explaination created using ChatGPT on 2025-08-18 22:40. (Please note: No guarantee for the correctness of this explanation)
Last html export of this page out of FM database by TL: 2025-09-21