tfplot
by Tim C. Lueth, SG-Lib Toolbox: SolidGeometry 5.6 - Analytical Geometry
Introduced first in SolidGeometry 1.0, Creation date: 2010-08-09, Last change: 2025-09-14
plots an HT matrix including the x/y plane
Description
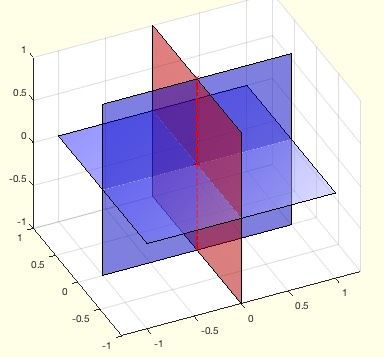
tfplot shows a 3D-plot figure of a HT Coordinate System and the x/y-plane. tfplot (T,c,f) shows the coordinate system of T and draws a closed plane of side length 2f in color c
same as plotTP
See Also: pplot
, lplot
, tlplot
, slplot
, plotTP
, plotL
, plotT
Example Illustration
Syntax
h=tfplot(T,[f,a,c1,c2,c3])
Input Parameter
T: | | HT Matrix |
f: | | size of plane; default is 1 |
a: | | Transparency alpha, default is 0.5 |
c1: | | Color; default is 'r' |
c2: | | Color; default is 'r' |
c3: | | Color; default is 'g' |
Output Parameter
Examples
simple experiment
T=eye(4), cla; tfplot (T,'r',0.5,'r','g','y'), view (-30,30); shg
T=eye(4), cla; tfplot (T,'r',1,'r','g','y'), view (-30,30); shg
Copyright 2010-2025 Tim C. Lueth. All rights reserved. The code is the property of Tim C. Lueth and may not be redistributed or modified without explicit written permission. This software may be used free of charge for academic research and teaching purposes only. Commercial use, redistribution, modification, or reverse engineering is strictly prohibited. Access to source code is restricted and granted only under specific agreements. For licensing inquiries or commercial use, please contact: Tim C. Lueth
Last html export of this page out of FM database by TL: 2025-09-21