slplot
by Tim C. Lueth, SG-Lib Toolbox: SolidGeometry 5.6 - Visualization
Introduced first in SolidGeometry 2.1, Creation date: 2015-01-26, Last change: 2025-09-14
straight line plot
See Also: , pplot
, lplot
, tfplot
, tlplot
, plotTP
, plotL
, plotT
Example Illustration
Syntax
slplot(p,[ez,c,w,l,d])
Input Parameter
p: | | starting point |
ez: | | direction if straight line |
c: | | line color |
w: | | line width; default is 1 |
l: | | line length; default is 10 |
d: | | color of the starting point |
Property names
'color' : Color of the straight line; default is 'r--'
'point' : Color of the start point; default is 'k.'
'length' : Length of the line; default is 10
'lineWidth' : Width of the straight line; default is 1
'color' :
'point' :
'length' :
'lineWidth' :
Examples
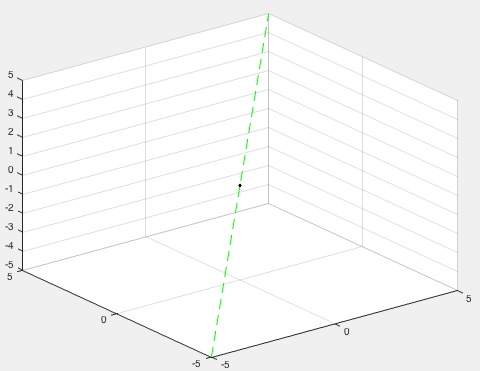
Plot a green straight line
slplot([0 0 0],[1 1 1],'color','g--')
Copyright 2015-2025 Tim C. Lueth. All rights reserved. The code is the property of Tim C. Lueth and may not be redistributed or modified without explicit written permission. This software may be used free of charge for academic research and teaching purposes only. Commercial use, redistribution, modification, or reverse engineering is strictly prohibited. Access to source code is restricted and granted only under specific agreements. For licensing inquiries or commercial use, please contact: Tim C. Lueth
Last html export of this page out of FM database by TL: 2025-09-21