lplots
by Tim C. Lueth, SG-Lib Toolbox: SolidGeometry 5.6 - Visualization
Introduced first in SolidGeometry 4.9, Creation date: 2020-02-21, Last change: 2025-09-14
plots a straight lines between 2 point lists
Description
plots a straight line between 2 point pairs
See Also: lplot
, pplot
, tfplot
, aplot
, tlplot
, slplot
, plotTP
, plotL
, plotT
Example Illustration
Syntax
h=lplots(P1L,P2L,[c,w,ts,ss,str,fs])
Input Parameter
P1L: | | Starting point |
P2L: | | End point |
c: | | Color and symbol default is "r*-" |
w: | | line width; default is 1 |
ts: | | tip size; 0==auto |
ss: | | start block size; 0==auto |
str: | | Text string at tip |
fs: | | font size of text |
Output Parameter
h: | | handle to all line elements |
Examples
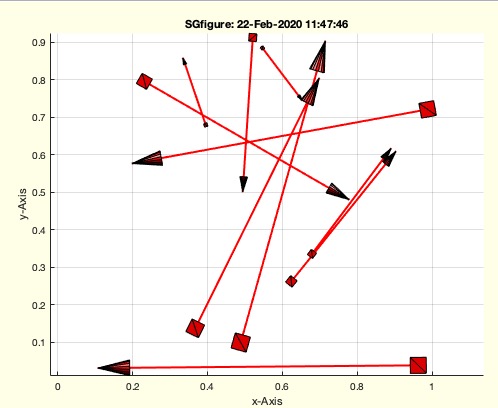
SGfigure; lplots(rand(10,2),rand(10,2),'r-',2,0,0)
Copyright 2020-2025 Tim C. Lueth. All rights reserved. The code is the property of Tim C. Lueth and may not be redistributed or modified without explicit written permission. This software may be used free of charge for academic research and teaching purposes only. Commercial use, redistribution, modification, or reverse engineering is strictly prohibited. Access to source code is restricted and granted only under specific agreements. For licensing inquiries or commercial use, please contact: Tim C. Lueth
Algorithm (Workflow)
This algorithm is a MATLAB function named lplots that plots straight lines between pairs of points. It is part of the SolidGeometry library and was introduced in version 4.9. The function is designed to visualize lines between two lists of points, with customizable appearance parameters.
Input Parameters
- P1L: A matrix representing the starting points of the lines. Each row corresponds to a point in 2D or 3D space.
- P2L: A matrix representing the end points of the lines. Each row corresponds to a point in 2D or 3D space.
- c: (Optional) A string specifying the color and symbol of the line. The default value is "r*-".
- w: (Optional) A scalar specifying the line width. The default value is 1.
- ts: (Optional) A scalar specifying the tip size. A value of 0 indicates automatic sizing.
- ss: (Optional) A scalar specifying the start block size. A value of 0 indicates automatic sizing.
- str: (Optional) A string to be displayed at the tip of the line.
- fs: (Optional) A scalar specifying the font size of the text. The default value is 16.
Output
- h: A handle to all line elements created by the function.
Algorithm Steps
- Check if either
P1L or P2L is empty. If so, return an empty handle h.
- Initialize an empty array
h to store line handles and enable the hold state for the current figure to allow multiple plots.
- Iterate over each row of
P1L and P2L to plot lines between corresponding points.
- For each pair of points, call the
lplot function with the current points and any additional parameters provided in varargin.
- Append the handle returned by
lplot to the array h.
The function is designed to handle multiple pairs of points, plotting a line for each pair. It allows customization of the line's appearance through optional parameters, providing flexibility in visualization.
Algorithm explaination created using ChatGPT on 2025-08-19 07:47. (Please note: No guarantee for the correctness of this explanation)
Last html export of this page out of FM database by TL: 2025-09-21