tplotruler
by Tim C. Lueth, SG-Lib Toolbox: SolidGeometry 5.6 - Visualization
Introduced first in SolidGeometry 5.2, Creation date: 2022-05-13, Last change: 2025-09-15
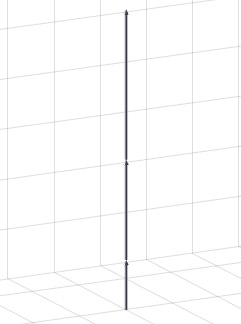
plots a 3D ruler als arrow sequence in a figure
See Also: tplot
, tplotangle
, tplotaxis
, SGruler
, rulerCPL
Example Illustration

Syntax
tplotruler([T,z,s,st])
Input Parameter
T: | | Frame to start the ruler along ez |
z: | | sequence of z values |
s: | | size; default is 15 |
st: | | z values; default is "delta", other is "coord" |
Copyright 2022-2025 Tim C. Lueth. All rights reserved. The code is the property of Tim C. Lueth and may not be redistributed or modified without explicit written permission. This software may be used free of charge for academic research and teaching purposes only. Commercial use, redistribution, modification, or reverse engineering is strictly prohibited. Access to source code is restricted and granted only under specific agreements. For licensing inquiries or commercial use, please contact: Tim C. Lueth
Algorithm (Workflow)
This algorithm is designed to plot a 3D ruler as an arrow sequence in a figure. It is part of the SolidGeometry library and was introduced in version 5.2. The function is called tplotruler and it takes several input parameters.
Input Parameters
- T: This is the frame from which the ruler starts along the ez axis. It is a 4x4 transformation matrix. If not provided, it defaults to the identity matrix
eye(4).
- z: This is a sequence of z values that determine the positions along the ruler. If not provided, it defaults to
[0 10 20 30].
- s: This parameter defines the size of the ruler. The default value is 15.
- st: This parameter specifies the style of the z values. It can be either
"delta" or "coord". The default is "delta".
Algorithm Steps
- The function retrieves the input parameters using
getfuncparams. If parameters are not provided, default values are used.
- The
switch statement checks the st parameter to determine how to handle the z values:
- Case 'coord': The z values are used as they are provided.
- Case 'delta': The z values are cumulatively summed using
cumsum(z) to create a sequence of positions.
- Otherwise: An error is thrown if the
st value is unknown.
- A matrix
VL is created with zeros in the first two columns and the z values in the third column.
- The function
TcopyVLez is called to transform the z values into a sequence of transformation matrices TL.
- A loop iterates over the z values to create and plot arrows between consecutive points:
- For each pair of consecutive z values, the start and end points
p1 and p2 are extracted from TL.
- The function
SGarrow is called to create an arrow between p1 and p2.
- The arrow is plotted using
SGplotalpha with a white color.
- The loop ends after processing all z values.
Algorithm explaination created using ChatGPT on 2025-08-19 00:59. (Please note: No guarantee for the correctness of this explanation)
Last html export of this page out of FM database by TL: 2025-09-21