tplot

by Tim C. Lueth, SG-Lib Toolbox: SolidGeometry 5.6 - Analytical Geometry
Introduced first in SolidGeometry 1.0, Creation date: 2010-06-01, Last change: 2025-09-14

plots a coordinate system given as HT matrix

Description

This is the first function that was clearly assigned to SG-Lib on 8/6/2010.
Does support 2D (3x3) and 3D (4x4) HT matrices
SG-Lib 4.7 supports cells of solids

See Also: pplot , lplot , tfplot , tlplot , slplot , plotTP , plotL , plotT , aplot

Example Illustration

 missing image of tplot(T,s,w,N,ts)

Syntax

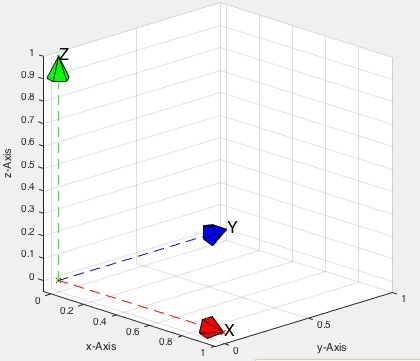
h=tplot(T,[s,w,N,ts])

Input Parameter

T: HT matrix of the coordinate system
s: size of the unit vectors, default is 1
w: width of the matlab lines, default is 1
N: Name of coordinate system
ts: if empty, no surfaces for tips and origin

Output Parameter

h:

Examples

Plots the Origin
plotT(eye(4),1,2,'A');


Copyright 2010-2025 Tim C. Lueth. All rights reserved. The code is the property of Tim C. Lueth and may not be redistributed or modified without explicit written permission. This software may be used free of charge for academic research and teaching purposes only. Commercial use, redistribution, modification, or reverse engineering is strictly prohibited. Access to source code is restricted and granted only under specific agreements. For licensing inquiries or commercial use, please contact: Tim C. Lueth

Last html export of this page out of FM database by TL: 2025-09-21