SGplot
by Tim C. Lueth, SG-Lib Toolbox: SolidGeometry 5.6 - Visualization
Introduced first in SolidGeometry 1.0, Creation date: 2012-11-21, Last change: 2025-09-14
plots a solid geometry
Description
Works with structure SG and cells of structures (SG1, SG2, ...}. Uses
SG.VL, Vertex list
SG.FL, Facet list
SG.col (optional) Color
SG.alpha (optional) Tansparancy
See Also: nofcolmap
, VLFLplot
, TRplot
, VLTLplot
, VLFLplot4
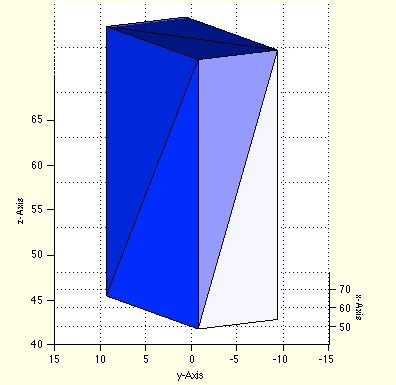
Example Illustration
Syntax
h=SGplot(SG,[c,w,T,N])
Input Parameter
SG: | | Solid Geometry Structure |
c: | | Color; Option for VLFLplot |
w: | | Width; Option for VLFLplot |
T: | | optional HT matrix |
N: | | optional Name of Coordinate System |
Output Parameter
Examples
SG1=SGofCPLz(PLcircle(10),10); SG2=SG1; SG3=SG1;
SGfigure(-30,30); SGplot (SG1,'r')
SGfigure(-30,30); SGplot ({SG1,SG2,SG3},'m')
Copyright 2012-2025 Tim C. Lueth. All rights reserved. The code is the property of Tim C. Lueth and may not be redistributed or modified without explicit written permission. This software may be used free of charge for academic research and teaching purposes only. Commercial use, redistribution, modification, or reverse engineering is strictly prohibited. Access to source code is restricted and granted only under specific agreements. For licensing inquiries or commercial use, please contact: Tim C. Lueth
Last html export of this page out of FM database by TL: 2025-09-21