VLELCILplots
by Tim C. Lueth, SG-Lib Toolbox: SolidGeometry 5.6 - Visualization
Introduced first in SolidGeometry 1.1, Creation date: 2013-09-29, Last change: 2025-09-14
plots contours given as vertex list and edge list
Description
This procedure draws a contour given by a vertex list (VL), edge list (EL) and contour index list (CIL) using VLELplots.
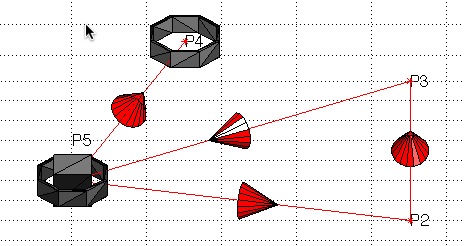
Example Illustration
Syntax
VLELCILplots(VL,EL,CIL,[c,w,t,b,f])
Input Parameter
VL: | | Vertex list |
EL: | | Edge list |
CIL: | | Contour index list |
c: | | Optional color of desired edges; default os 'r*-' |
w: | | Optional line width; default is 1 |
t: | | Size of a cone shaped arrow tip, default is 0 |
b: | | Size of a cube showing the start point of a contour; default is 0 |
f: | | Size of a ring showing the end point of a contour; default is 0 |
Copyright 2013-2025 Tim C. Lueth. All rights reserved. The code is the property of Tim C. Lueth and may not be redistributed or modified without explicit written permission. This software may be used free of charge for academic research and teaching purposes only. Commercial use, redistribution, modification, or reverse engineering is strictly prohibited. Access to source code is restricted and granted only under specific agreements. For licensing inquiries or commercial use, please contact: Tim C. Lueth
Algorithm (Workflow)
This MATLAB function, VLELCILplots, is designed to plot contours based on a vertex list (VL), edge list (EL), and contour index list (CIL). The function is part of the SG-Library and was created by Tim Lueth in 2013. It utilizes another function, VLELplots, to perform the actual plotting.
Input Parameters
- VL: Vertex list - A list of vertices that define the points in the plot.
- EL: Edge list - A list of edges that connect the vertices, defining the lines in the plot.
- CIL: Contour index list - A list that specifies the start and end indices of each contour within the edge list.
- c: (Optional) Color of the edges. Default is 'r*-' (red with star markers and solid line).
- w: (Optional) Line width. Default is 1.
- t: (Optional) Size of a cone-shaped arrow tip. Default is 0, meaning no arrow tip.
- b: (Optional) Size of a cube showing the start point of a contour. Default is 0, meaning no cube.
- f: (Optional) Size of a ring showing the end point of a contour. Default is 0, meaning no ring.
Algorithm Steps
- Determine the number of contours by calculating the number of rows in the
CIL matrix using n=size(CIL,1);.
- Iterate over each contour using a for-loop:
for i=1:n.
- For each contour, extract the relevant segment of the edge list using the indices specified in
CIL: EL(CIL(i,1):CIL(i,2),:).
- Call the
VLELplots function with the vertex list, the extracted edge list segment, and any additional parameters passed through varargin.
The function is designed to be flexible, allowing the user to specify optional parameters for customizing the appearance of the plot, such as color, line width, and markers for the start and end points of contours.
Algorithm explaination created using ChatGPT on 2025-08-18 23:32. (Please note: No guarantee for the correctness of this explanation)
Last html export of this page out of FM database by TL: 2025-09-21