SGplotcellmultiple
by Tim C. Lueth, SG-Lib Toolbox: SolidGeometry 5.6 - Visualization
Introduced first in SolidGeometry 4.9, Creation date: 2020-06-21, Last change: 2025-09-14
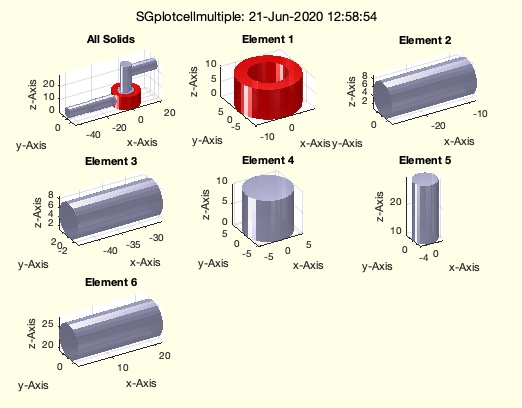
Creates a SGfigure and plots all cell elements in different subplots
Description
It also plots the frames
See Also: SGplot
, SGplotcell
, SGwriteMultipleSTL
, view4all
, axisscale
Example Illustration
Syntax
h=SGplotcellmultiple(SGc,[,"scale","frames"])
Input Parameter
SGc: | | Cell list of Solids that should be printed |
"scale": | | if used, all figures show the frames too |
"frames": | | |
Output Parameter
h: | | handle to graphics objects |
Examples
A=SGsample(20)
SGplotcellmultiple(A);            % plot all with maximum size
SGplotcellmultiple(A,'scale');    % Plot all in the same scale
Copyright 2020-2025 Tim C. Lueth. All rights reserved. The code is the property of Tim C. Lueth and may not be redistributed or modified without explicit written permission. This software may be used free of charge for academic research and teaching purposes only. Commercial use, redistribution, modification, or reverse engineering is strictly prohibited. Access to source code is restricted and granted only under specific agreements. For licensing inquiries or commercial use, please contact: Tim C. Lueth
Last html export of this page out of FM database by TL: 2025-09-21