SGplotcell
by Tim C. Lueth, SG-Lib Toolbox: SolidGeometry 5.6 - Surfaces
Introduced first in SolidGeometry 4.6, Creation date: 2019-05-26, Last change: 2025-09-14
plot a cell list solid in different colors
Description
it plots until the facet difference is less than 1e-4
See Also: SGsurfacessort
, SGsurfaces
, SGplotsurfaces
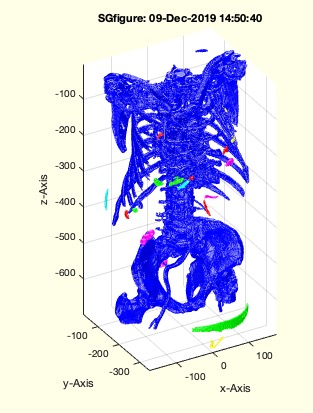
Example Illustration
Syntax
h=SGplotcell(SG,[c,w])
Input Parameter
SG: | | cell list of solid |
c: | | color |
w: | | width |
Output Parameter
Copyright 2019-2025 Tim C. Lueth. All rights reserved. The code is the property of Tim C. Lueth and may not be redistributed or modified without explicit written permission. This software may be used free of charge for academic research and teaching purposes only. Commercial use, redistribution, modification, or reverse engineering is strictly prohibited. Access to source code is restricted and granted only under specific agreements. For licensing inquiries or commercial use, please contact: Tim C. Lueth
Algorithm (Workflow)
This function, SGplotcell, is designed to plot a list of solid cells with different colors. It is part of the SolidGeometry library and was introduced in version 4.6. The function takes a cell list of solids and optional parameters for color and width, and returns a handle to the plot.
Input Parameters
- SG: A cell list representing the solid geometry to be plotted.
- c: (Optional) A string representing the color for plotting. Default is 'r' (red).
- w: (Optional) A numeric value representing the width of the plot lines.
Output
- h: A handle to the plot, which can be used for further manipulation or querying of the plot.
Algorithm Steps
- Set a tolerance level
tol to 2e-4 for determining when to stop plotting based on facet differences.
- Initialize
firstplot as false to track if the first plot has been drawn.
- Sort the surfaces of
SG using SGsurfacessort with the 'facet' option, and calculate the total number of facets nf.
- Initialize counters
kf and pfa to zero.
- Check if
SG is not a cell. If true, call SGplot with the given arguments and return the handle.
- If
SG is a cell, iterate over each element:
- Determine the color for the current element using
colofn with the index and a color string 'gymcbwr'.
- Plot the current element using
SGplotalpha with the determined color and an alpha value of 1.
- Update the handle list
h with the new plot handles.
- Update the facet counter
kf and calculate the current plot fraction pf.
- If
firstplot is false and the difference between pf and pfa is less than tol, call drawnow, set firstplot to true, and break the loop.
- Update
pfa with the current pf.
Algorithm explaination created using ChatGPT on 2025-08-19 07:35. (Please note: No guarantee for the correctness of this explanation)
Last html export of this page out of FM database by TL: 2025-09-21