SGplotsurfaces
by Tim C. Lueth, SG-Lib Toolbox: SolidGeometry 5.6 - User interface
Introduced first in SolidGeometry 4.1, Creation date: 2017-08-16, Last change: 2025-09-14
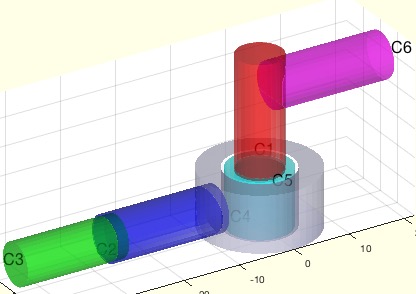
plots closed surface of the solids seperatly in different colors
Description
very similar to SGsurfaceplot, but more a clear plotting function
See Also: SGseparate
, SGsurfacessort
, SGsurfaces
, SGplotcell
Example Illustration
Syntax
h=SGplotsurfaces(SG,[col,Fs,si])
Input Parameter
SG: | | Solid Geoemtry |
col: | | color force; default is ''; |
Fs: | | Font size for descriptors; default is 0 |
si: | | surface selectors |
Output Parameter
Examples
SGfigure; view(-30,30); SGplotsurfaces(SGsample(17))
SGfigure; view(-30,30); SGplotsurfaces(SGsample(17),'',16);
SGfigure; view(-30,30); SGplotsurfaces(SGsample(17),'m',16);
Copyright 2017-2025 Tim C. Lueth. All rights reserved. The code is the property of Tim C. Lueth and may not be redistributed or modified without explicit written permission. This software may be used free of charge for academic research and teaching purposes only. Commercial use, redistribution, modification, or reverse engineering is strictly prohibited. Access to source code is restricted and granted only under specific agreements. For licensing inquiries or commercial use, please contact: Tim C. Lueth
Algorithm (Workflow)
This function, SGplotsurfaces, is designed to plot closed surfaces of solids separately in different colors. It is part of the SolidGeometry library and was introduced in version 4.1. The function is similar to SGsurfaceplot but focuses on clearer plotting.
Input Parameters
- SG: Represents the solid geometry data.
- col: Specifies the color for the plot. The default is an empty string, which means colors will be assigned automatically.
- Fs: Font size for descriptors. The default value is 16.
- si: Surface selectors, which determine which surfaces to plot. By default, all surfaces are selected.
Output
- h: A handle to the drawing, which can be used for further manipulation or querying of the plot.
Algorithm Steps
- The function begins by separating the solid geometry using
SGseparate, which returns the separated geometry and a list of indices SIL.
- Default values are set for
col, Fs, and si if they are not provided.
- The number of surfaces
n is determined from the size of SIL.
- If
si is empty, it is set to include all surfaces from 1 to n.
- The function iterates over each selected surface index in
si:
- For each surface, vertices and faces are selected using
VLFLselect.
- If
col is not specified, a color is assigned based on the index.
- The first surface is given a transparency of 0.5.
- The surface is plotted using
SGplot, and lighting is set with setplotlight.
- If
Fs is greater than 0, a text label is added to the plot using textVL.
- The handle
h is updated with each plot and text label created.
Algorithm explaination created using ChatGPT on 2025-08-19 07:40. (Please note: No guarantee for the correctness of this explanation)
Last html export of this page out of FM database by TL: 2025-09-21