by Tim C. Lueth, SG-Lib Toolbox: SolidGeometry 5.6 - Visualization
Introduced first in SolidGeometry 4.2, Creation date: 2018-07-10, Last change: 2025-08-18
h=gcahandleofSG
h: | handle of all patches in gca |
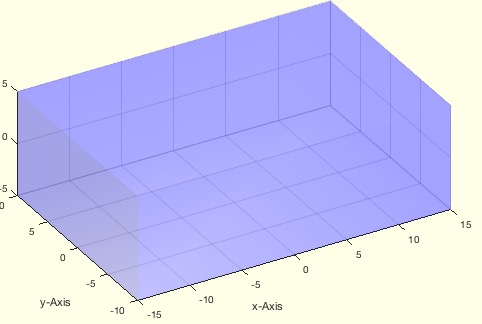
SGfigure; view(-30,30); SGplot(SGbox([30,20,10]));
setplotlight(gcahandleofSG,'b',0.2), showThis function, gcahandleofSG, is designed to return the handle to all patches in the current graphics axis (gca). It is part of the SolidGeometry library and is used for visualization purposes, such as changing color, transparency, or creating a solid geometry (SG).
The function does not take any input parameters.
The function returns a variable h, which is the handle of all patches in the current graphics axis.
get(gca, 'Children').ispatch function.h.nargout == 0), perform the following actions:
setplotlight with the handles h, color 'r', and transparency 0.90.show function to display the changes.The function can be used in a script as follows:
SGfigure;
view(-30,30);
SGplot(SGbox([30,20,10]));
setplotlight(gcahandleofSG,'b',0.2), show;
This example creates a figure, sets the view, plots a box, and then sets the plot light with a blue color and 0.2 transparency.
Algorithm explaination created using ChatGPT on 2025-08-18 22:46. (Please note: No guarantee for the correctness of this explanation)