by Tim C. Lueth, SG-Lib Toolbox: SolidGeometry 5.6 - Visualization
Introduced first in SolidGeometry 4.9, Creation date: 2020-06-16, Last change: 2025-09-14
h=textCPL(CPL,[c,s,nt,lb])
CPL: | Contour list separated by Nan (CPL/CVL) | |
c: | Color, default is black | |
s: | Size, default is 16 | |
nt: | optional list of selected contours | |
lb: | optional string for text; default is 'C' |
h: | handle to text |
Different examples for plotting
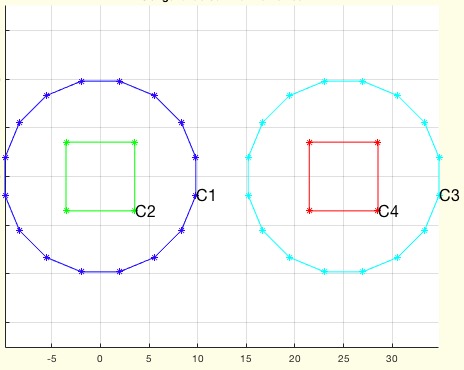
SGfigure; CPL=CPLsample(12); CPLplotasPS(CPL); textCPL(CPL);
This function, textCPL, is designed to plot descriptors for each contour in a given contour list (CPL) using the text command. It is part of the SG-Library and was introduced in SolidGeometry 4.9. The function is a visualization tool that marks up to 99 contours at their first point with a letter and a number.
The function begins by checking the number of input arguments (nargin) and assigns default values if certain parameters are not provided:
c is not provided, it defaults to black ('k').s is not provided, it defaults to 16.nt is not provided, it defaults to all contours separated by NaN, determined by the function separateNaN(CPL).lb is not provided, it defaults to 'cpl'.The function then calls another function, textCVL, passing the contour list and any additional parameters provided. The handle to the text object created by textCVL is returned as the output.
This function is a work in progress as of July 8, 2025, and is not ready for final release. It is part of a suite of visualization tools that include functions like textT, textP, textVL, and others, which are used for various plotting and visualization tasks in the SG-Library.