textVL
by Tim C. Lueth, SG-Lib Toolbox: SolidGeometry 5.6 - Visualization
Introduced first in SolidGeometry 1.0, Creation date: 2012-07-29, Last change: 2025-09-14
plots descriptors for each vertex in the figure using the text command
Description
plots either point descriptors into the figure of all point in VL or selects justs the numbers given in list nt. 99 points are the maximum number of points that will be plottet.
If the length(lb) == number of points, the points are marked by the letters lb(i).
See Also: textT
, textP
, textCVL
, textVLFL
, VLFLfaceNormalplot
Example Illustration
Syntax
h=textVL(VL,[c,s,nt,lb])
Input Parameter
VL: | | Vertex list |
c: | | Color, default is black |
s: | | Size, default is 10 |
nt: | | optional list of selected points |
lb: | | optional string for text; default is 'F' |
Output Parameter
h: | | handle to graphics object |
Examples
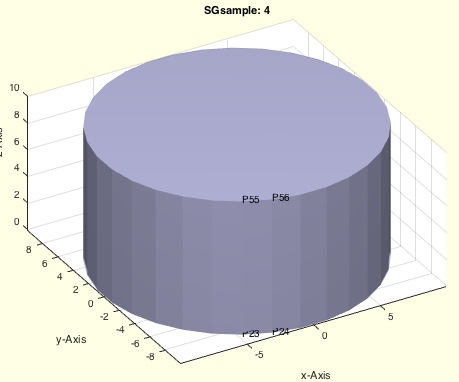
Different examples for plotting
SGsample(4); a=SGsample(4); textVL(a.VL,[],12,[23 24 55 56]); view (-130,30)
SG=SGbox([60,40,20]); SGfigure(SG); view(-30,30); textVL(SG.VL,[],16)
SG=SGbox([60,40,20]); SGfigure(SG); view(-30,30); textVL(SG.VL,[],16,[],'A')
SG=SGbox([60,40,20]); SGfigure(SG); view(-30,30); textVL(SG.VL,[],16,[],'ABCDEFGH')
Copyright 2012-2025 Tim C. Lueth. All rights reserved. The code is the property of Tim C. Lueth and may not be redistributed or modified without explicit written permission. This software may be used free of charge for academic research and teaching purposes only. Commercial use, redistribution, modification, or reverse engineering is strictly prohibited. Access to source code is restricted and granted only under specific agreements. For licensing inquiries or commercial use, please contact: Tim C. Lueth
Last html export of this page out of FM database by TL: 2025-09-21